Dateiliste
Aus Controlling-Wiki
Diese Spezialseite listet alle hochgeladenen Dateien auf.
| Datum | Name | Vorschaubild | Größe | Benutzer | Beschreibung | Versionen |
|---|---|---|---|---|---|---|
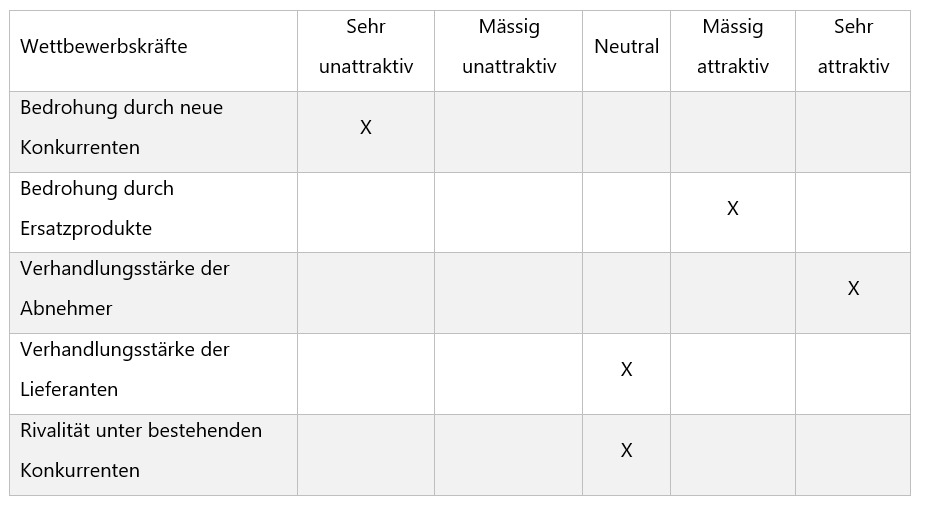
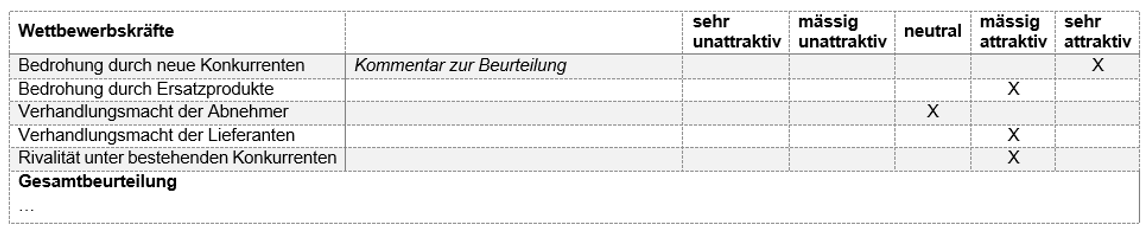
| 15:08, 18. Mai 2021 | Lösung Beurteilung Branchenstrukturanalyse.jpg (Datei) |  |
53 KB | Schmidlin.Marco | 1 | |
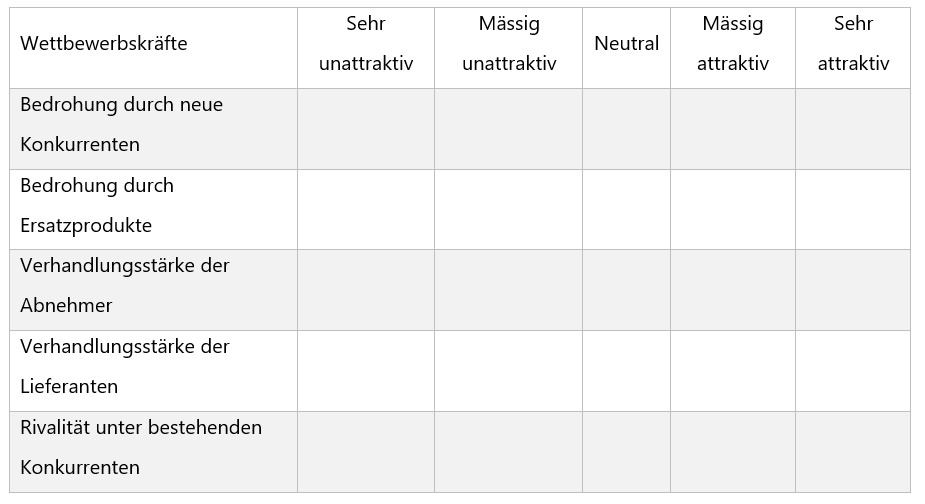
| 15:01, 18. Mai 2021 | Tabelle zur Beurteilung der Branchenstrukturanalyse.jpg (Datei) |  |
49 KB | Schmidlin.Marco | 1 | |
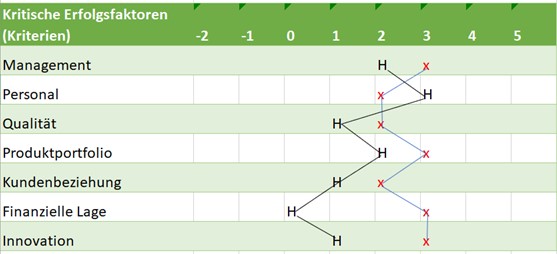
| 09:05, 18. Mai 2021 | Stärken-Schwächen-Profil Fallstudie Lösung.jpg (Datei) |  |
31 KB | Suter.Manuel | 1 | |
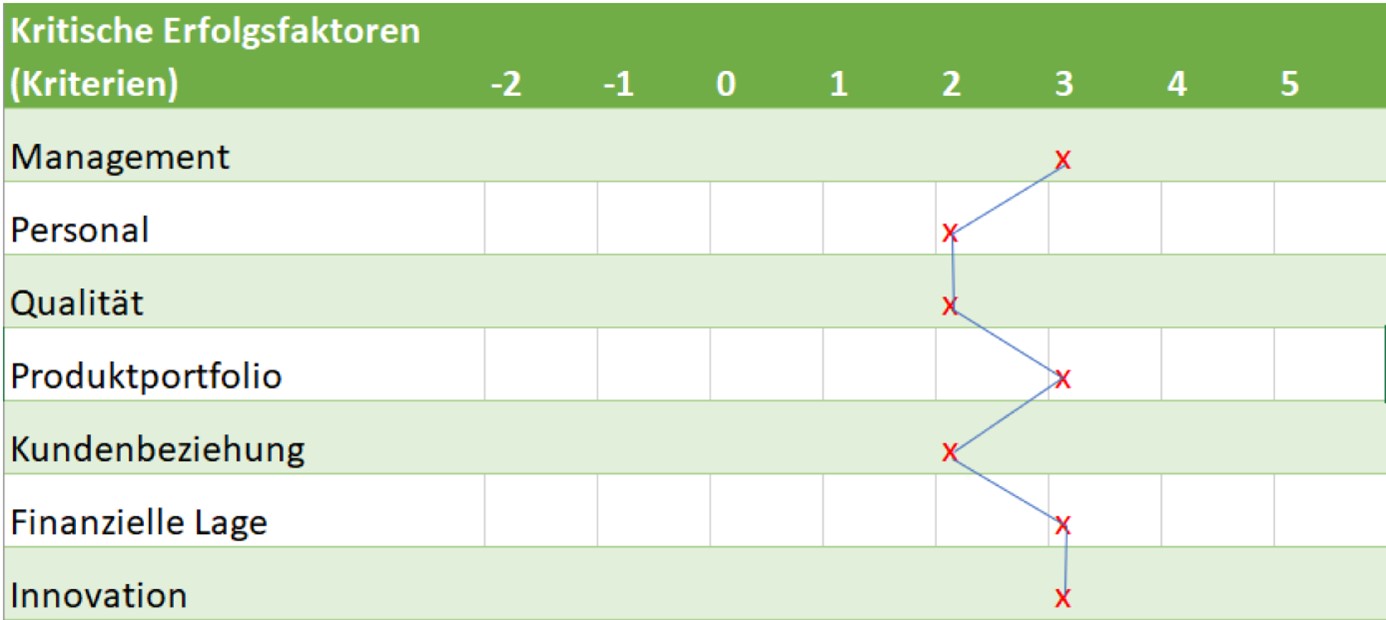
| 08:55, 18. Mai 2021 | Stärken-Schwächen-Profil Fallstudie.jpg (Datei) |  |
90 KB | Suter.Manuel | 1 | |
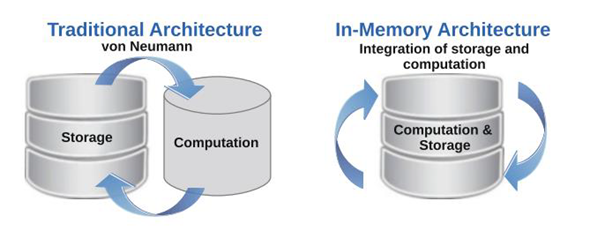
| 20:35, 17. Mai 2021 | Traditional Architecture vs. In-Memory Architecture.png (Datei) |  |
128 KB | Hüsing.DominicLukas | Abb. 1: Traditional Architecture vs. In-Memory Architecture (Shirinzadeh & Drechsler, 2020, S.2) | 1 |
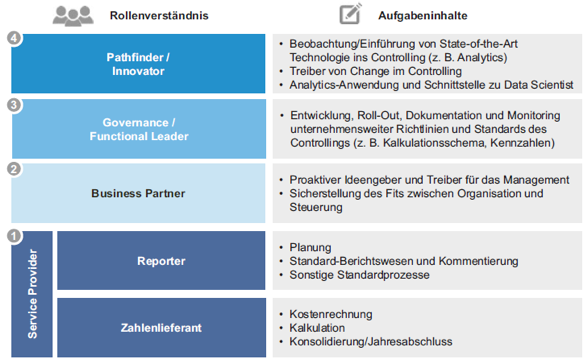
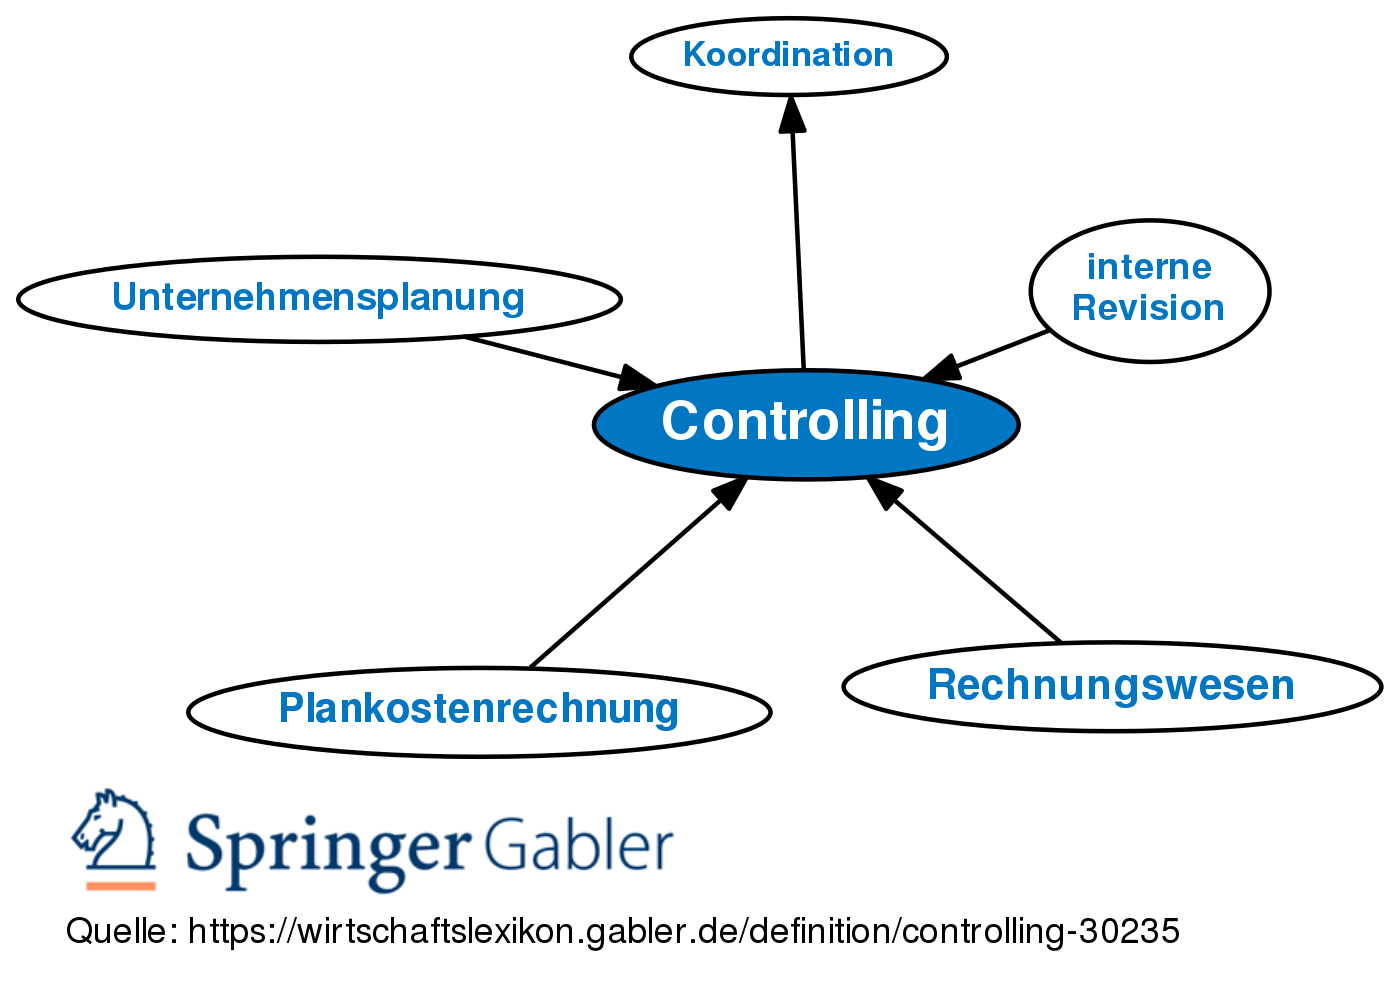
| 16:26, 16. Mai 2021 | Rollen des Controllings.png (Datei) |  |
131 KB | Ognjanovic.Milos | Rollen des Controllings (Langmann, 2019, S. 43) | 1 |
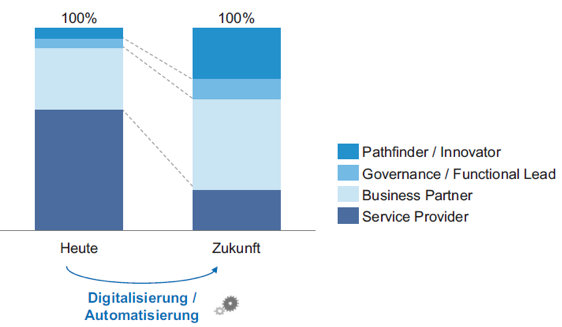
| 16:17, 16. Mai 2021 | Schwerpunkte von Controlling-Rollen.png (Datei) |  |
39 KB | Ognjanovic.Milos | Veränderung der künftigen Schwerpunkte von Controlling-Rollen (Langmann, 2019, S. 46) | 1 |
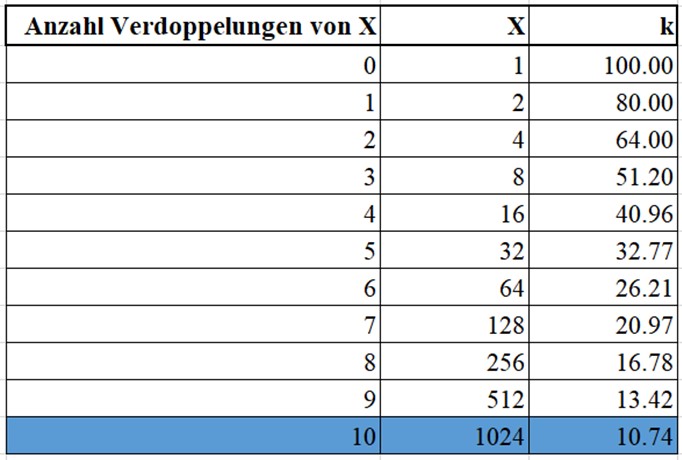
| 13:58, 16. Mai 2021 | Zahlenbeispiel.jpg (Datei) |  |
57 KB | Bucheli.Raphael | Abb. 1: Zahlenbeispiel (in Anlehnung an: Sabel & Weiser, 2008, S. 54). | 1 |
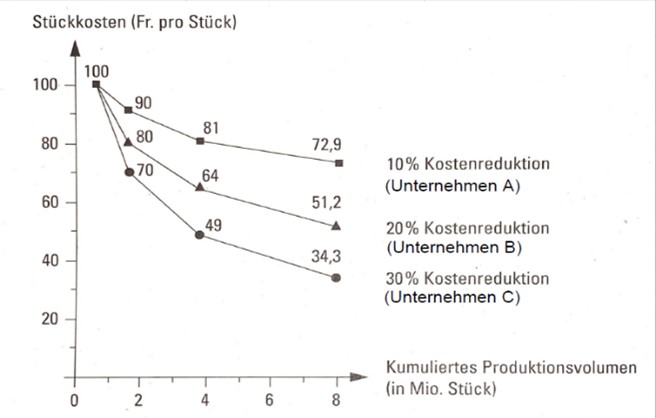
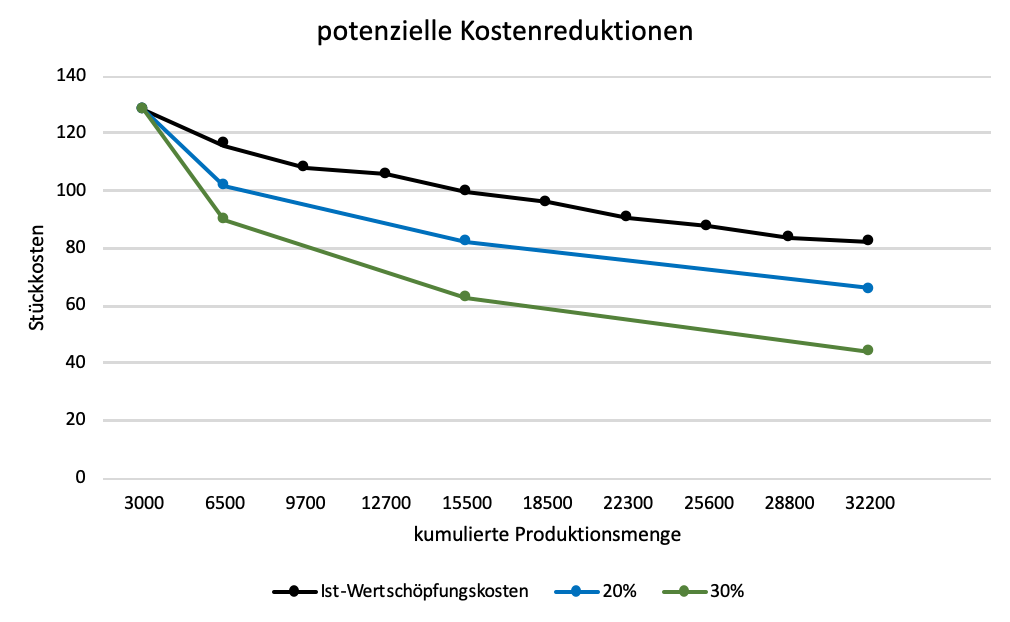
| 13:57, 16. Mai 2021 | Erfahrungskurve.jpg (Datei) |  |
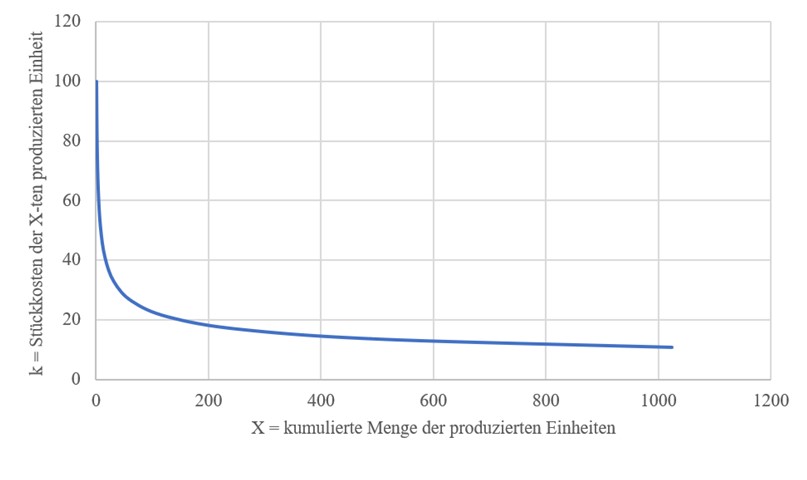
35 KB | Bucheli.Raphael | Abb. 2: Erfahrungskurve (in Anlehnung an: Sabel & Weiser, 2008, S. 54). | 1 |
| 12:48, 16. Mai 2021 | Kosten- und Preiserfahrungskurve.jpg (Datei) |  |
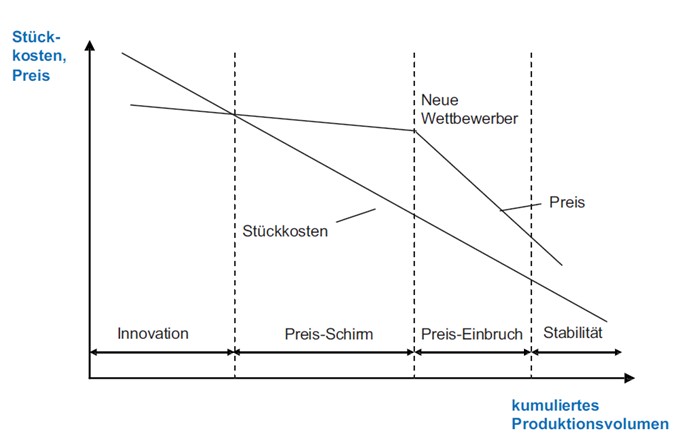
34 KB | Bucheli.Raphael | Abb. 3. Kosten- und Preiserfahrungskurve (in Anlehnung an: Bea & Haas, 2017, S. 149). | 2 |
| 10:52, 16. Mai 2021 | Dynamische und statische Effekte.jpg (Datei) |  |
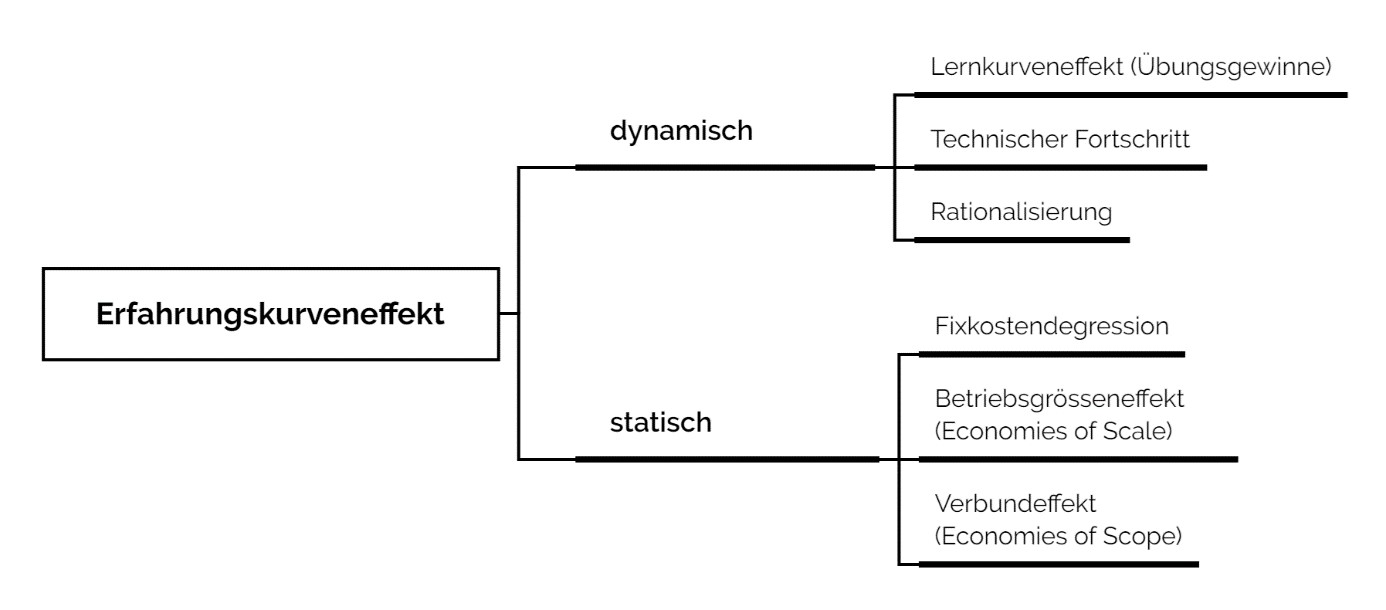
68 KB | Bucheli.Raphael | Abbildung 1: Dynamische und statische Effekte (in Anlehnung an: Coenenberg et al., 2016, S. 437). | 1 |
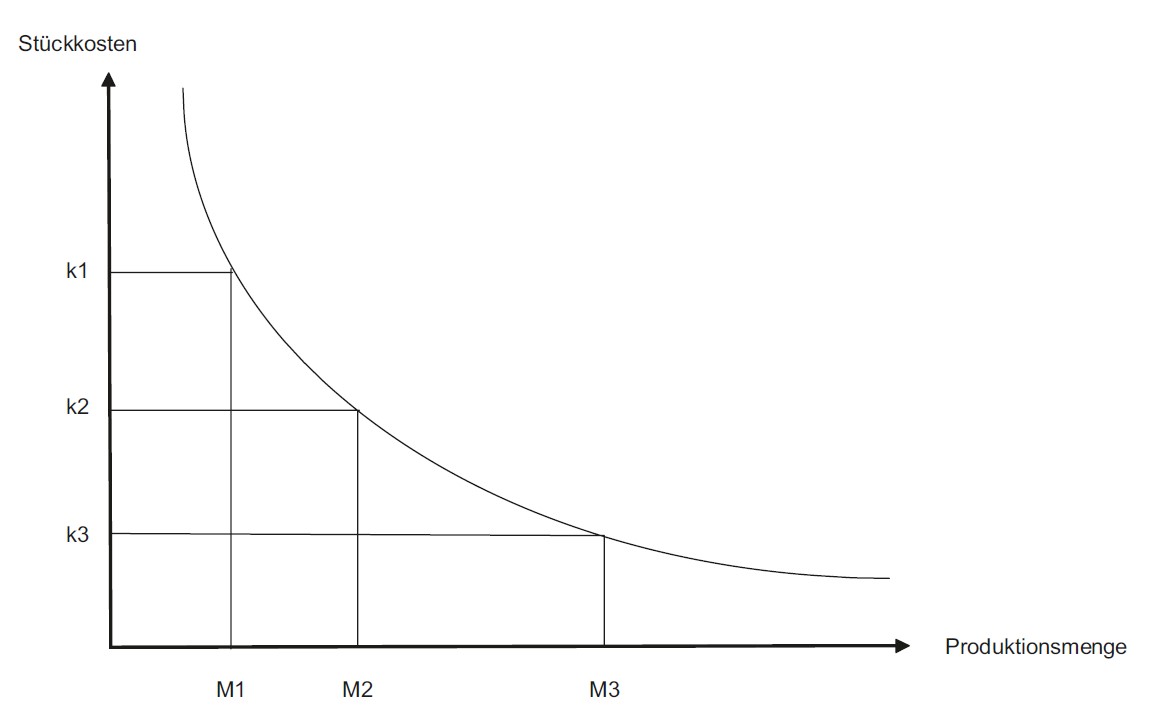
| 10:51, 16. Mai 2021 | Beispielhafte Darstellung Erfahrungskurve.jpg (Datei) |  |
36 KB | Bucheli.Raphael | Zurückgesetzt auf die Version vom 16. Mai 2021, 10:34 Uhr (CEST) | 6 |
| 10:22, 16. Mai 2021 | Erfahrungskurven mit unterschiedlichen Entwicklungen.jpg (Datei) |  |
34 KB | Bucheli.Raphael | Abb. 2: Erfahrungskurven mit unterschiedlichen Entwick-lungen (in Anlehnung an: Lombriser & Abplanalp, 2018, S. 204). | 1 |
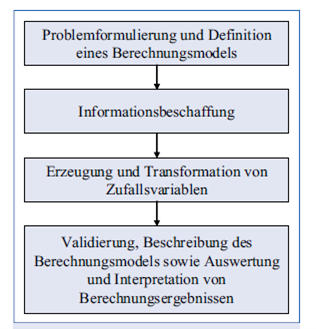
| 10:10, 16. Mai 2021 | Vorgehensweise der Monte-Carlo-Simulation nach Wolf.png (Datei) |  |
49 KB | Strebel.Anja | 1 | |
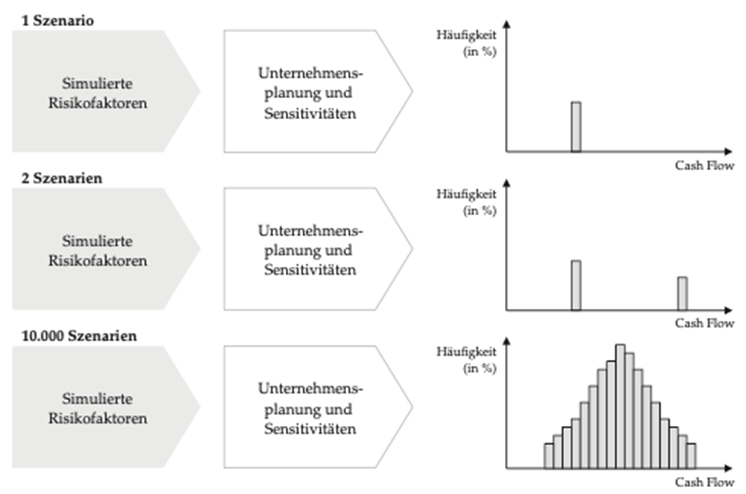
| 10:09, 16. Mai 2021 | Szenarienanalyse mittels Monte-Carlo-Simulation.png (Datei) |  |
90 KB | Strebel.Anja | 1 | |
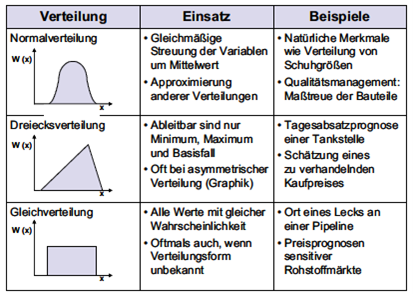
| 10:08, 16. Mai 2021 | Häufige Verteilungsformen in Monte-Carlo-Simulationen.png (Datei) |  |
100 KB | Strebel.Anja | 1 | |
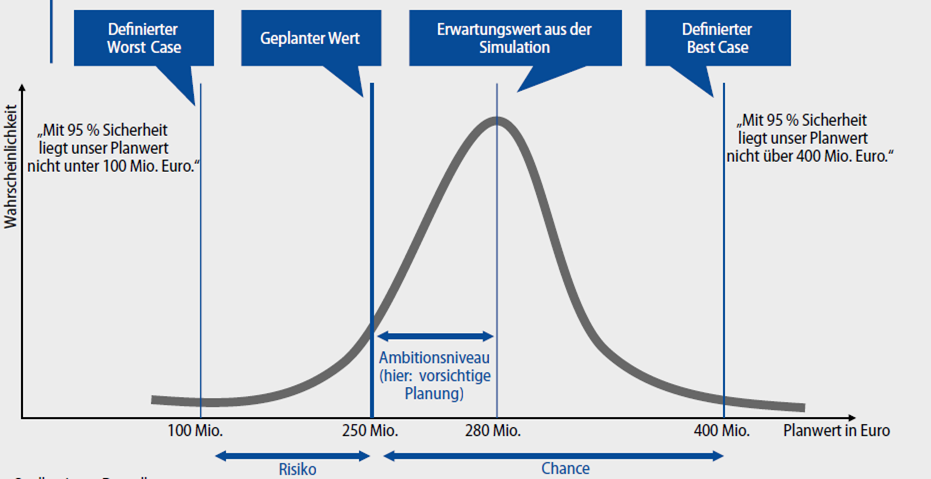
| 10:07, 16. Mai 2021 | Ergebnis einer Simulation in der Unternehmensplanung.png (Datei) |  |
110 KB | Strebel.Anja | 1 | |
| 17:01, 15. Mai 2021 | Lösung Aufg.2.png (Datei) |  |
68 KB | Ammann.NicolasJan | 1 | |
| 12:15, 15. Mai 2021 | Rollenverteilung.jpg (Datei) |  |
80 KB | Killer.Jennifer | 1 | |
| 14:01, 11. Mai 2021 | Beurteilung Branchenstrukturanalyse.png (Datei) | 77 KB | Schmidlin.Marco | 1 | ||
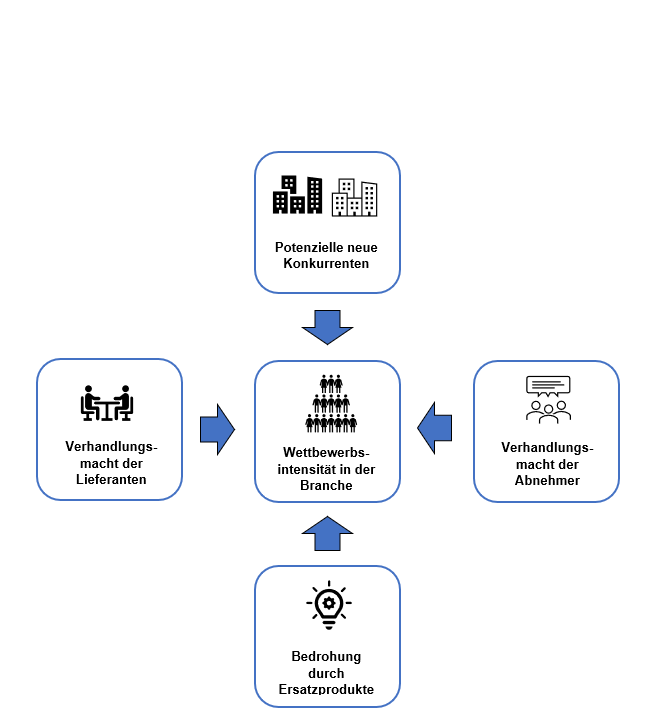
| 13:48, 11. Mai 2021 | 5 Forces nach Porter1.png (Datei) |  |
33 KB | Schmidlin.Marco | 1 | |
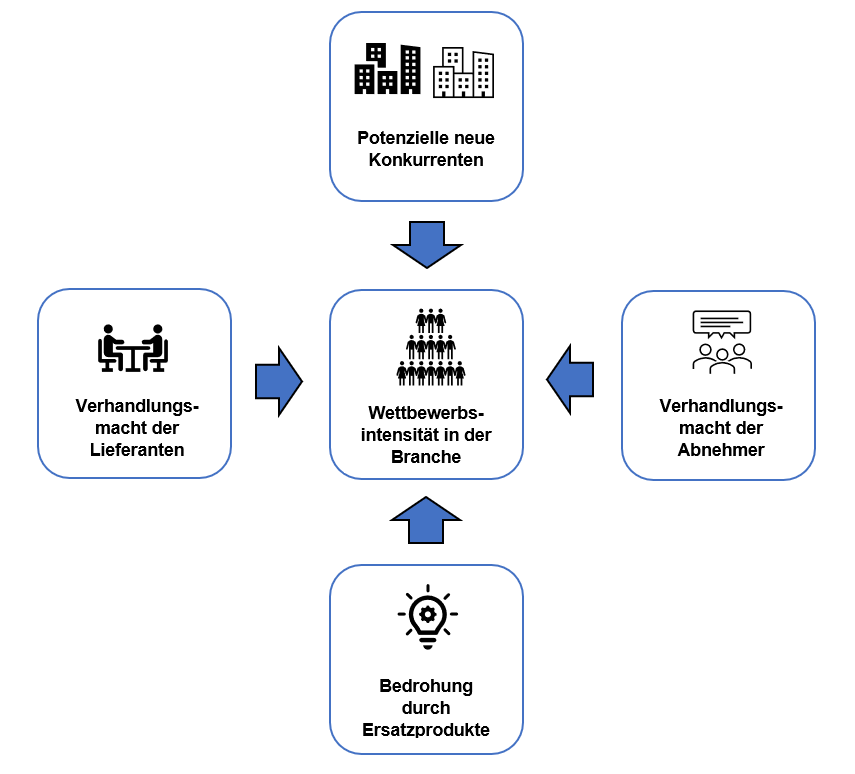
| 13:44, 11. Mai 2021 | 5 Forces nach Porter.png (Datei) |  |
24 KB | Schmidlin.Marco | 1 | |
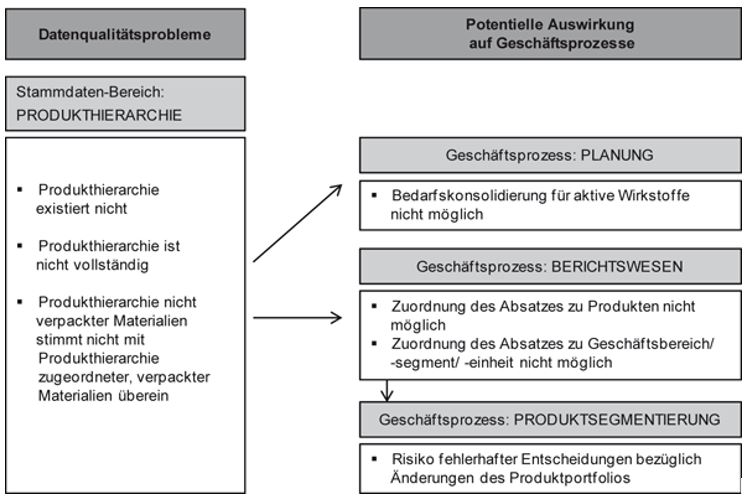
| 14:22, 10. Mai 2021 | Lösung Datenqualität Bayer CropScience AG.jpg (Datei) |  |
68 KB | Leipold.Valentin | Abb. 1: Lösung - Bedeutung der Qualität von Produkthierarchiedaten (Brauer, 2019, S. 17 zit. in Otto & Österle, 2016, S. 60) | 1 |
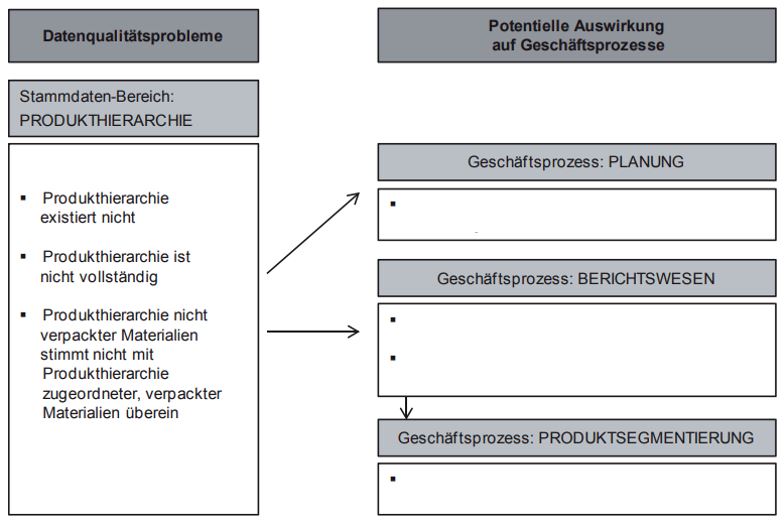
| 14:14, 10. Mai 2021 | Aufgabe Datenqualität Bayer CropScience AG.jpg (Datei) |  |
61 KB | Leipold.Valentin | Abb. 1: Bedeutung der Qualität von Produkthierarchiedaten (Brauer, 2019, S. 17 zit. in Otto & Österle, 2016, S. 60 | 1 |
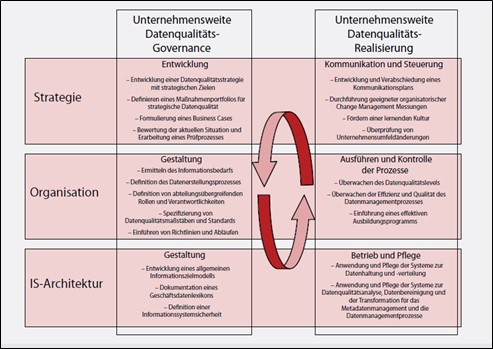
| 14:06, 10. Mai 2021 | CDQ-Modell Baumöl&Meschke2009.jpg (Datei) |  |
54 KB | Leipold.Valentin | Abb. 4: CDQ-Modell (Baumöl & Meschke, 2009, S. 64) | 1 |
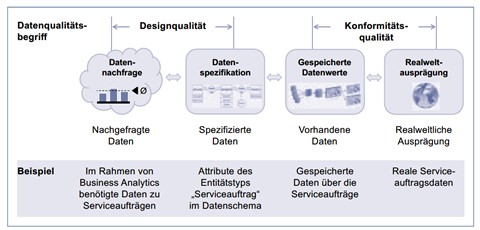
| 14:04, 10. Mai 2021 | Datelqualitaetsperspektiven Klier&Heinrich2016.jpg (Datei) |  |
31 KB | Leipold.Valentin | Abb. 3: Die Datenqualitätsperspektiven (Klier & Heinrich, 2016, S. 489) | 1 |
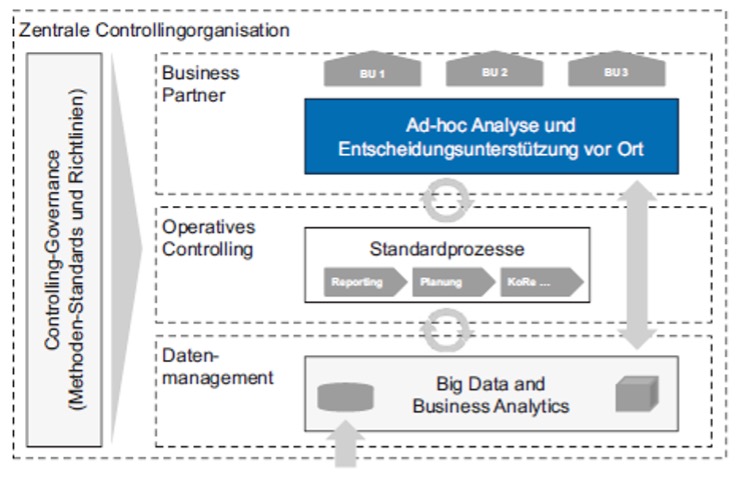
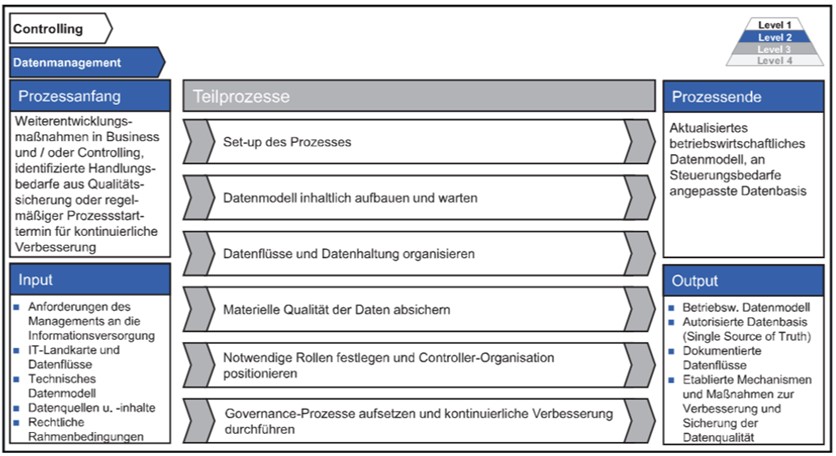
| 13:56, 10. Mai 2021 | Controlling-Prozess Datenmanagement.jpeg (Datei) |  |
104 KB | Leipold.Valentin | 1 | |
| 13:49, 10. Mai 2021 | Controlling-Prozess Datenmanagement Gleich&Tschandl2018.jpg (Datei) |  |
104 KB | Leipold.Valentin | 1 | |
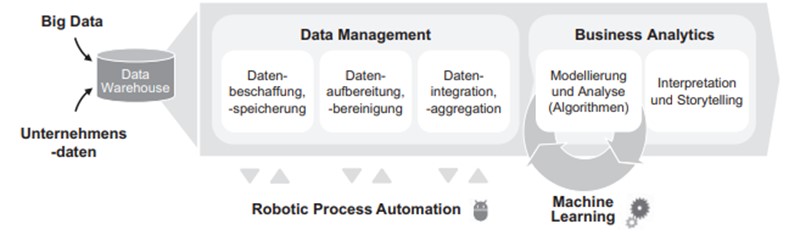
| 13:31, 10. Mai 2021 | Datenmanagement als Schnittstelle Langmann2019.jpg (Datei) |  |
31 KB | Leipold.Valentin | 1 | |
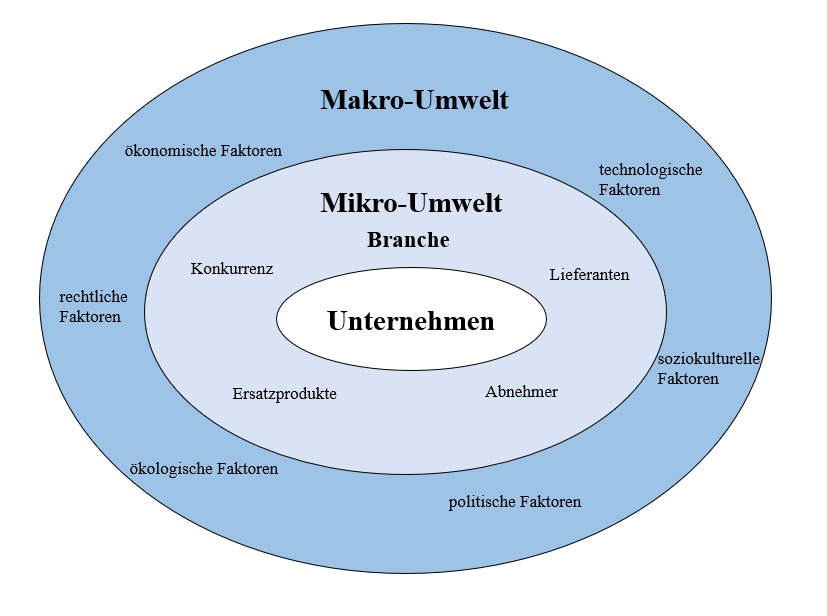
| 15:52, 6. Mai 2021 | Mikro- und Makroumwelt.jpg (Datei) |  |
59 KB | Schmidlin.Marco | 1 | |
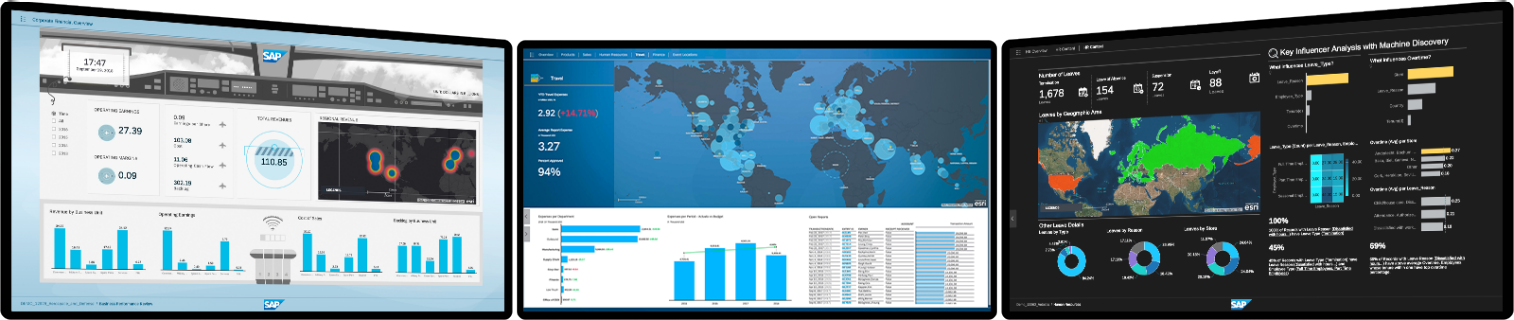
| 11:23, 6. Mai 2021 | Abbildung 1 Beispiel Digitalboardroom.png (Datei) | 388 KB | Mathis.Christa | 2 | ||
| 11:14, 6. Mai 2021 | SAP Struktur.png (Datei) |  |
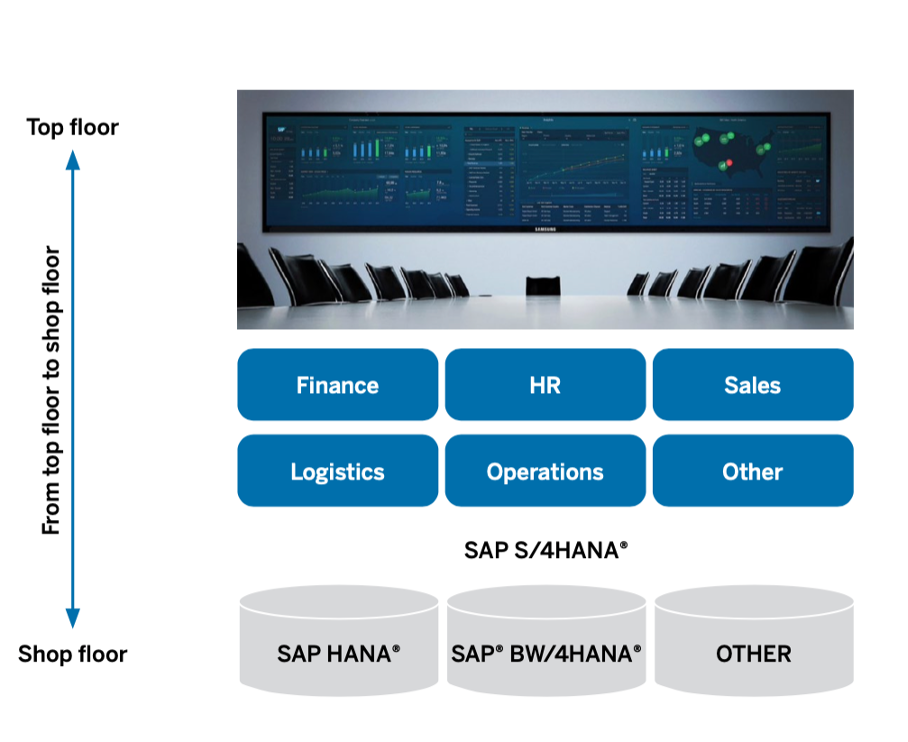
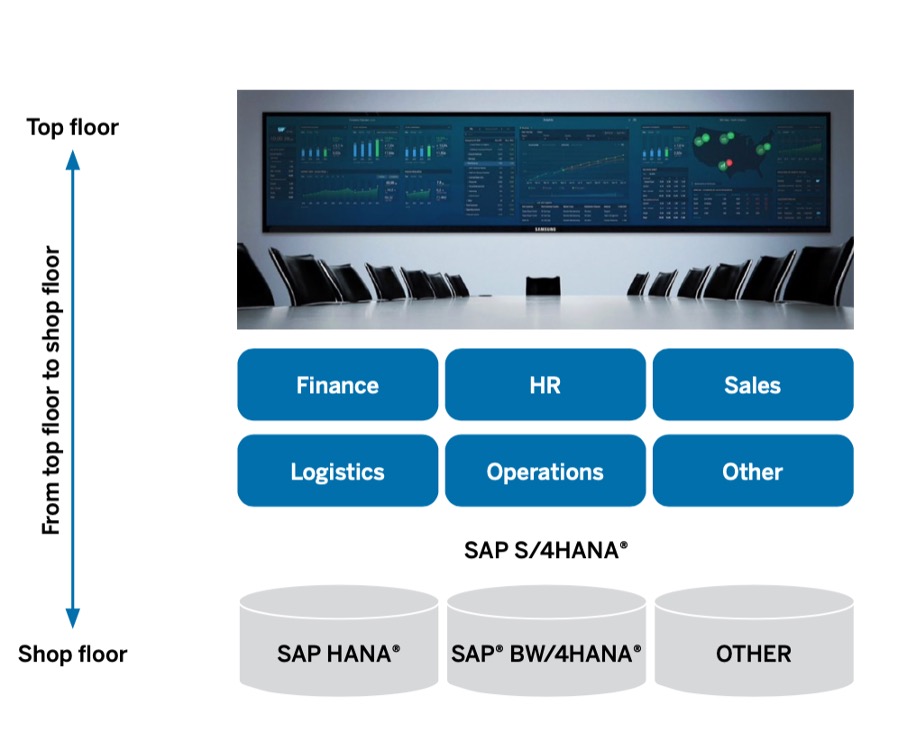
313 KB | Milosavljevic.Sofija | Abb. 2: Aufbau der IT-Struktur eines Digital Boardrooms (SAP (c), online) | 1 |
| 11:10, 6. Mai 2021 | Abbildung 2 Struktur.jpg (Datei) |  |
87 KB | Milosavljevic.Sofija | 2 | |
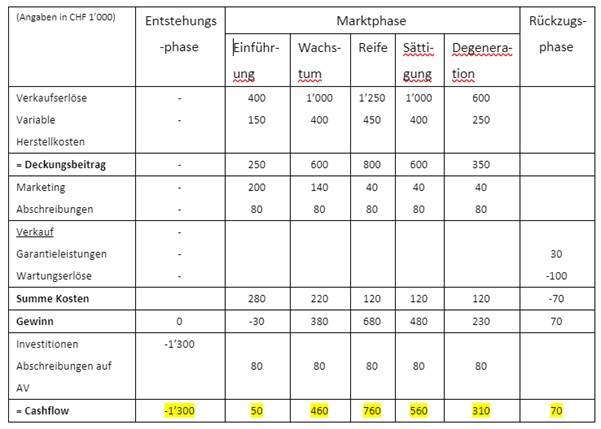
| 11:47, 4. Mai 2021 | Lösung.JPG (Datei) |  |
56 KB | Casillo.Lucas | 1 | |
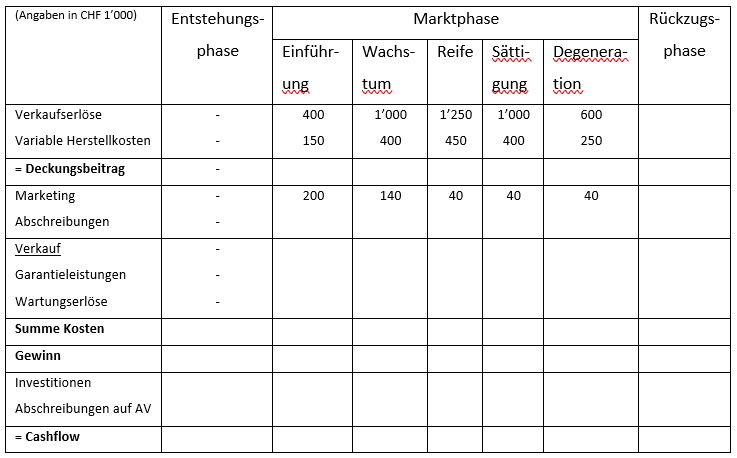
| 11:44, 4. Mai 2021 | Aufgabe.JPG (Datei) |  |
58 KB | Casillo.Lucas | 1 | |
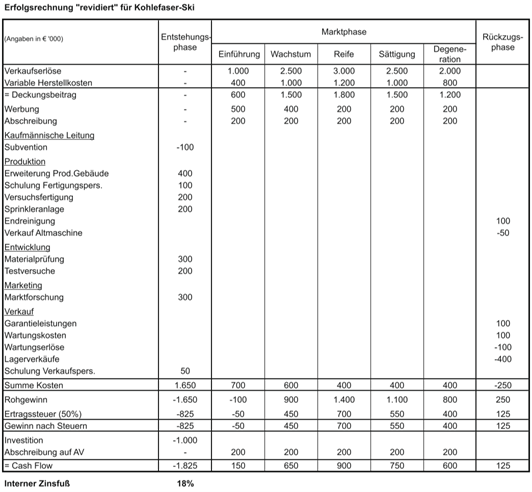
| 11:33, 4. Mai 2021 | LCC.JPG (Datei) |  |
45 KB | Casillo.Lucas | 1 | |
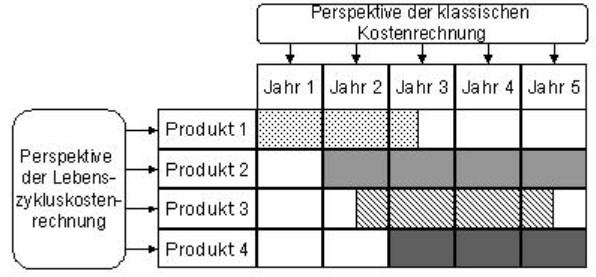
| 11:22, 4. Mai 2021 | Struktur LCC.PNG (Datei) |  |
70 KB | Casillo.Lucas | 1 | |
| 11:17, 4. Mai 2021 | Life Cycle Costing.jpg (Datei) |  |
45 KB | Casillo.Lucas | 1 | |
| 11:11, 4. Mai 2021 | Life Cycle Costing.JPEG (Datei) |  |
45 KB | Casillo.Lucas | 1 | |
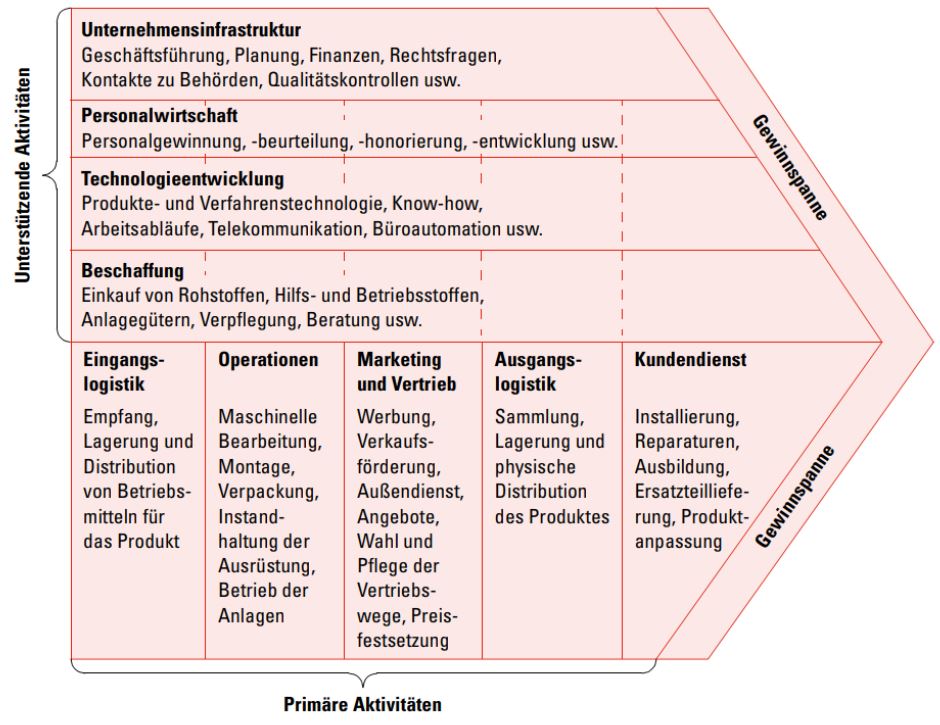
| 16:44, 3. Mai 2021 | Modell einer Wertkette.JPG (Datei) |  |
120 KB | Suter.Manuel | Porter, 2014, S. 76 | 1 |
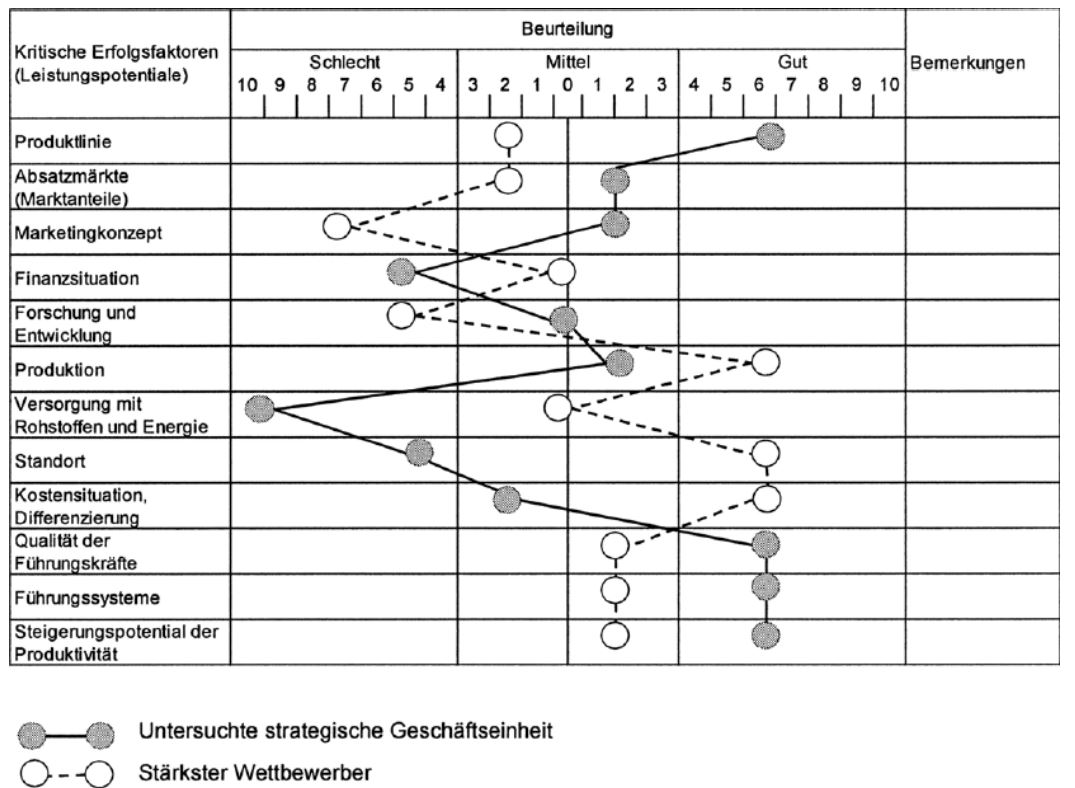
| 16:40, 3. Mai 2021 | Beispiel einer Potenzialanalyse.JPG (Datei) |  |
120 KB | Suter.Manuel | Joos-Sache, 2006, S. 16 | 1 |
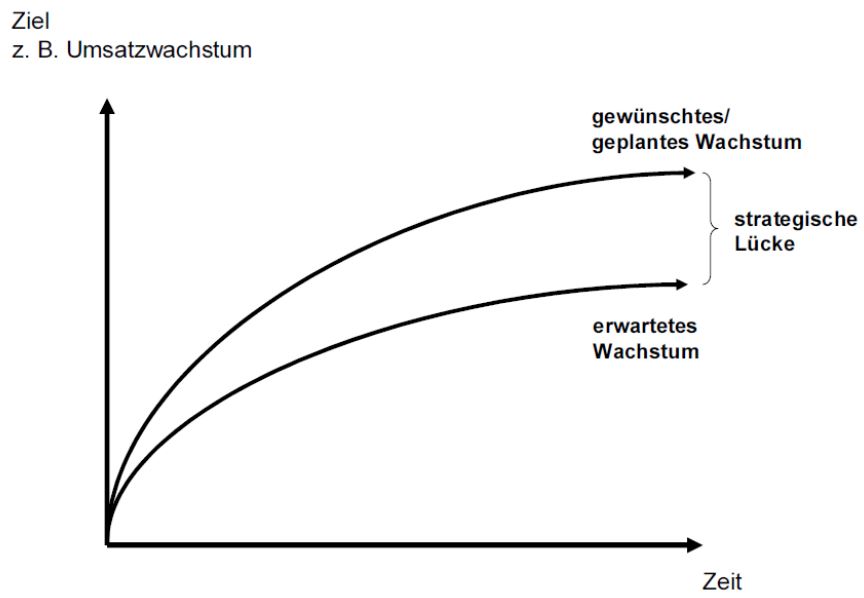
| 16:37, 3. Mai 2021 | Strategische Lücke.JPG (Datei) |  |
37 KB | Suter.Manuel | Erichsen, 2011, S. 374 | 1 |
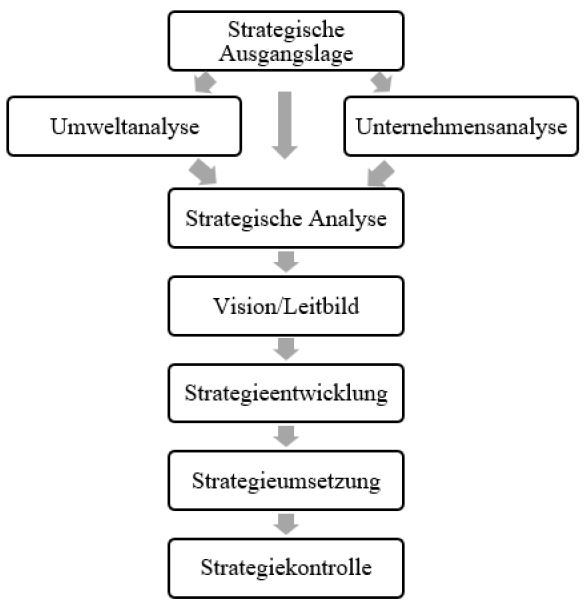
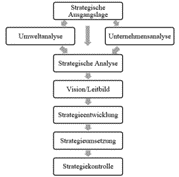
| 16:28, 3. Mai 2021 | Modell strategisches Management.JPG (Datei) |  |
43 KB | Suter.Manuel | 1 | |
| 16:10, 3. Mai 2021 | Modell des strategischen Managements.png (Datei) |  |
4 KB | Suter.Manuel | in Anlehnung an Lombriser & Abplanalp, 2018, S. 50 | 1 |
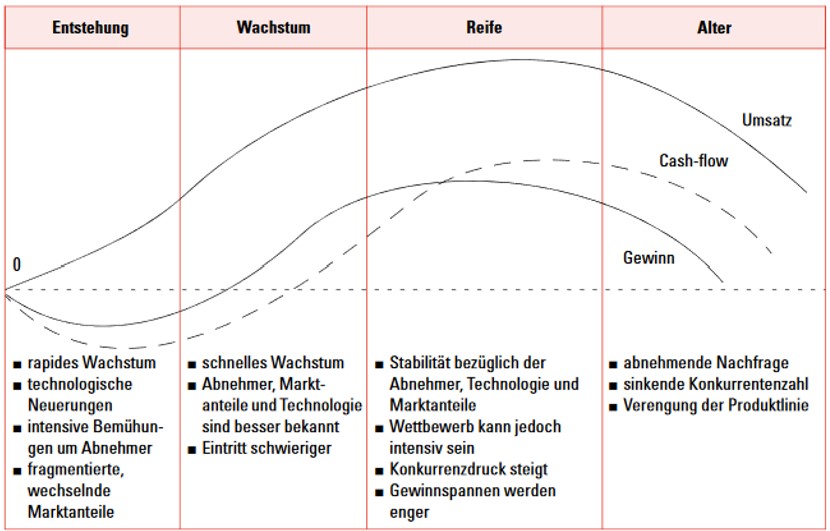
| 15:31, 3. Mai 2021 | Branchenlebenszyklus.jpg (Datei) |  |
88 KB | Dzaferi.Belmina | Zurückgesetzt auf die Version vom 3. Mai 2021, 15:30 Uhr (CEST) | 4 |
| 14:50, 28. Apr. 2021 | Test 2 Controlling.jpeg (Datei) |  |
65 KB | Leipold.Valentin | (Hostettler, 2002, S. 31) | 1 |
| 14:28, 28. Apr. 2021 | Test 2.jpg (Datei) |  |
65 KB | Leipold.Valentin | 1 | |
| 14:07, 28. Apr. 2021 | Test Controlling.png (Datei) |  |
150 KB | Leipold.Valentin | 1 | |
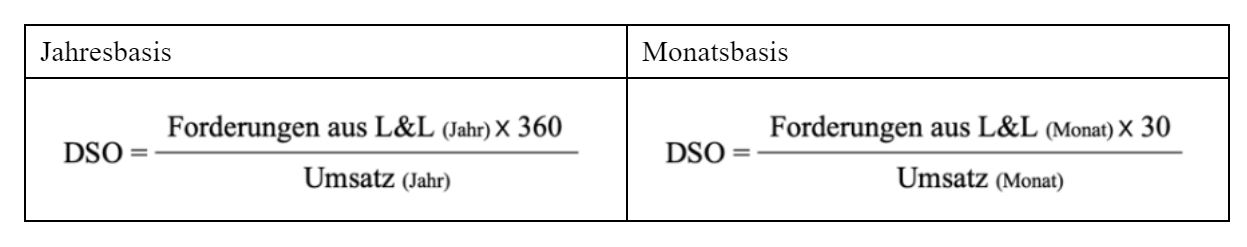
| 13:57, 27. Apr. 2021 | DSO Formel.JPG (Datei) | 37 KB | Filliger.DarioAndrin | 1 | ||
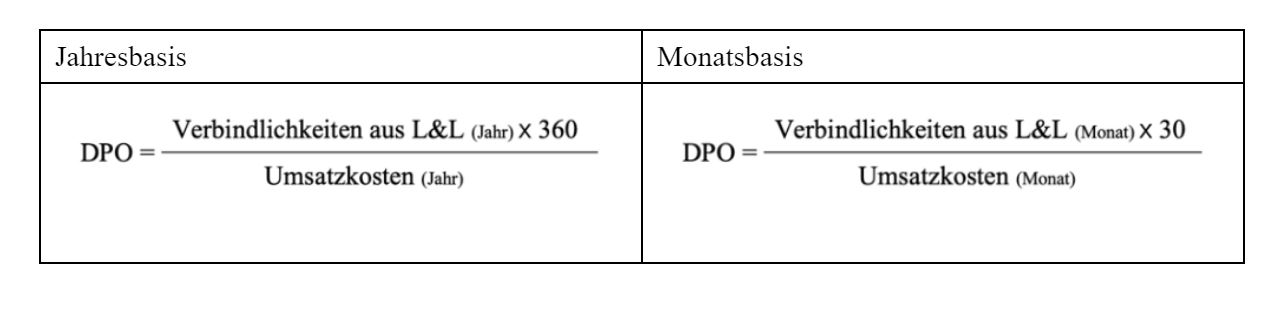
| 13:57, 27. Apr. 2021 | DPO Formel.JPG (Datei) | 41 KB | Filliger.DarioAndrin | 1 |