Nicht kategorisierte Dateien
Aus Controlling-Wiki
Nachfolgend werden bis zu 50 Ergebnisse im Bereich #401 bis #450 angezeigt.
-
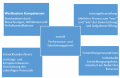 MbO Deutsche Post Abbildung 1.png 743 × 481; 40 KB
-
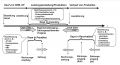
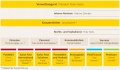
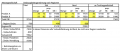 Mehrdimesnionale deckungsbeitragsrechnung.png 778 × 330; 68 KB
-
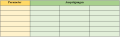
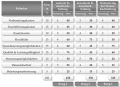
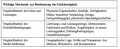 Merkmale zur Bestimmung der Gleichartigkeit.png 340 × 139; 33 KB
-
-
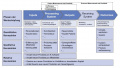
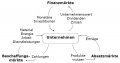
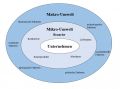 Mikro- und Makroumwelt.jpg 827 × 616; 59 KB
-
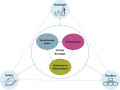
 Modell des strategischen Managements.png 179 × 177; 4 KB
-
 Modell einer Wertkette.JPG 940 × 725; 120 KB
-
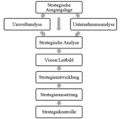
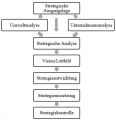 Modell strategisches Management.JPG 586 × 604; 43 KB
-
 Morphologischer Kasten leer.png 1.359 × 423; 12 KB
-
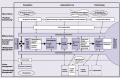 Multiprojektmanagement und Multiprojektcontrolling im Überblick.png 831 × 542; 75 KB
-

-
-
-
-
-
-
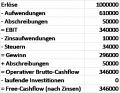 Möbel AG Berechnung Cashflow (Lösung).png 412 × 321; 15 KB
-
 Möglichkeiten zur Reduzierung von Working Capital.jpg 1.740 × 938; 234 KB
-
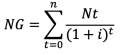 NG.png 386 × 176; 14 KB
-
 Nadig.jpg 337 × 449; 108 KB
-
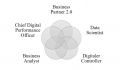 Neue Rollen des Controllers.jpg 844 × 492; 35 KB
-
 Northland.png 296 × 253; 50 KB
-
 Nr. 1.PNG 280 × 59; 2 KB
-
 Nr. 2.PNG 422 × 62; 3 KB
-
 Nr. 3.PNG 438 × 53; 3 KB
-
 Nr. 4.PNG 275 × 68; 2 KB
-
 Nutzwertanalyse.png 987 × 712; 286 KB
-
 OKR-Zyklus.png 2.062 × 275; 15 KB
-
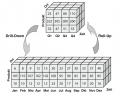 OLAP Roll-Up und Drill-Down (Müller & Lenz, 2013, S. 55).png 1.047 × 824; 121 KB
-
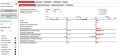 OnlineReporting.png 897 × 418; 283 KB
-
 OrganisationKunden.png 651 × 445; 76 KB
-
 OrganisationProzesse.png 638 × 426; 79 KB
-
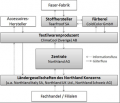
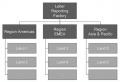
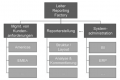
 Organisation Post.jpg 1.552 × 910; 129 KB
-
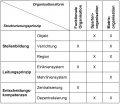 Organisationsformen.jpg 2.106 × 1.827; 245 KB
-
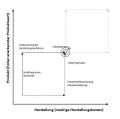 Outpacing-Strategie.jpg 499 × 496; 24 KB
-
 PDCA Zyklus.png 577 × 275; 82 KB
-
 Performance Measurement Simons.jpg 735 × 387; 30 KB
-
 Personal-Investitionskonto.png 1.931 × 376; 32 KB
-
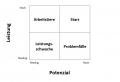 Personalportfolio.PNG 898 × 610; 18 KB
-
 Phasen der Plankostenrechnung.png 1.265 × 842; 311 KB
-
 Plankostenrechnung.png 1.301 × 660; 25 KB
-
 Planungsebenen.png 315 × 206; 14 KB
-
 Planungsebenen des Advanced Budgetings im Überblick.png 1.386 × 775; 274 KB
-
 Planungshorizonte und dir resultierenden Planungsstufen.png 1.308 × 310; 62 KB
-
 Planungsprozess eines Unternehmens.png 1.357 × 649; 85 KB
-
 Planungsprozess eines Unternehmens2.png 1.357 × 649; 85 KB
-
 Portalgrafik Codez.jpg 1.329 × 1.000; 101 KB
-
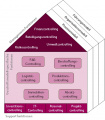 Portalgrafik Funktionales Controlling.jpg 538 × 613; 114 KB
-
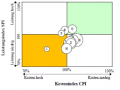 Portfolio-Analyse Projekte.png 307 × 230; 22 KB
-
 Potential Ausschnitt Demo-Datenbank Asago AG.png 1.181 × 421; 181 KB


.jpg)


.png)


.png)


