Nicht kategorisierte Dateien
Aus Controlling-Wiki
Unten werden bis zu 100 Ergebnisse im Bereich 101 bis 200 angezeigt.
Zeige (vorherige 100 | nächste 100) (20 | 50 | 100 | 250 | 500)
 Aufgabe 5.jpg 1.139 × 722; 88 KB
 Aufgabe 6.jpg 851 × 246; 42 KB
 Aufgabe Datenqualität Bayer CropScience AG.jpg 784 × 524; 61 KB
 Aufgabe TecXPhone AG.pdf ; 144 KB
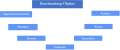
 Aufgaben Beschaffungscontrolling.jpg 1.197 × 559; 62 KB
 Aufgaben IT.PNG 1.011 × 380; 157 KB
 Aufgaben des Absatzcontrollings.png 782 × 429; 151 KB
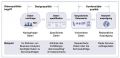
 Aufgabentypen des Controllings (Eder, 2016, S. 104).png 480 × 185; 20 KB
 Aufschlüsselung der Gesamtabweichung.png 1.867 × 617; 61 KB
 Aufspaltung des Erlöses in edogene und exogene Ursachen.jpg 879 × 601; 53 KB
 Aufstellung des familienfreundlichen Pakets (Seidel, 2010, S. 49).png 586 × 344; 168 KB
 Augustus AG Auswertung.png 943 × 479; 90 KB
 Augustus AG Rangfolge.PNG 1.210 × 772; 282 KB
 Ausgewählte Anpassungen bei der NOPAT-Ermittlung.png 686 × 425; 90 KB
 Auswahl Messgrössen.jpg 3.077 × 1.919; 387 KB
 BCG Matrix Lippold.PNG 605 × 364; 67 KB
- BIVAL Fallstudie.pdf ; 56 KB
 BI Anwendungsklassen.png 722 × 349; 31 KB
 BSC-basiertes Anreizsystem Becker, Schwertner & Seubert 2004.jpg 846 × 516; 45 KB
 BSC - Social Media Marketing Perspektive.png 1.979 × 714; 74 KB
 BS Simons.png 706 × 535; 28 KB
 Backlog und Sprintbacklog.png 700 × 342; 17 KB
 Basisschema Centererfolgsrechnung.jpg 696 × 250; 21 KB
 Baubewilligung.png 860 × 629; 294 KB
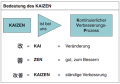 Bedeutung Kaizen.png 480 × 336; 59 KB
 Beispiel Balanced Scorecard.jpg 1.292 × 768; 179 KB
 Beispiel Komponentenmethode.png 740 × 283; 96 KB
 Beispiel Transformation von fixen Kosten in variable Kosten.jpg 1.753 × 1.040; 217 KB
 Beispiel einer Potenzialanalyse.JPG 1.075 × 788; 120 KB
 Beispiel einer Ursache-Wirkungskette.PNG 733 × 597; 16 KB
 Beispiel eines Absatzplanes.png 324 × 176; 9 KB
 Beispiel für ein Zielvereinbarungsformular.png 787 × 412; 21 KB
 Beispiel für unterschiedliche Bewertungsverfahren.jpeg 758 × 394; 100 KB
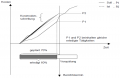
 Beispielhafte Darstellung Erfahrungskurve.jpg 1.160 × 718; 36 KB
 Beitragsanalyse.png 798 × 432; 142 KB
 Bellcore Organisation.jpg 1.627 × 1.142; 185 KB
 Benchmarking-Objekte.jpg 2.078 × 806; 100 KB
 Benchmarking-Objekte.png 2.080 × 861; 92 KB
 Benchmarkingprozess.png 197 × 714; 41 KB
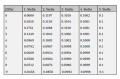 Benfordsches Gesetz.png 605 × 400; 134 KB
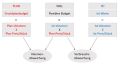 Berechnung flexibles Budget.jpg 605 × 330; 31 KB
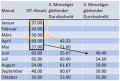 Berechnung gleitender Durchschnitt.png 323 × 217; 56 KB
 Beschaffungscontrolling Component Chart.png 478 × 463; 20 KB
 Beschreibung.png 906 × 114; 30 KB
 Best-Case-Szenario-Bleistifte.jpg 1.648 × 844; 117 KB
 Bestandteile Verrechnungspreisdokumentation.png 755 × 221; 16 KB
 Bestandteile von Business Analytics.jpg 1.115 × 601; 85 KB
 Bestimmung des Deckungsbeitrags.jpg 386 × 184; 14 KB
 Beurteilung Branchenstrukturanalyse.png 1.145 × 233; 77 KB
 Bewertungsansätze.png 1.439 × 965; 103 KB
 Bild1.png 425 × 260; 67 KB
 Bild2.png 388 × 362; 18 KB
 Bild 2.png 1.918 × 1.261; 170 KB
 Bild Branchen.png 2.624 × 1.625; 178 KB
 Bild Social Media.png 2.659 × 1.244; 157 KB
 Bild Trumpf.jpg 920 × 615; 76 KB
 Bild Veränderung Conversions.jpg 610 × 224; 69 KB
 Bild Vorgehen.png 2.803 × 871; 95 KB
 Bildschirmfoto 2024-04-25 um 12.28.19.png 420 × 178; 17 KB
 Bildschirmfoto 2024-04-25 um 12.34.27.png 406 × 196; 17 KB
 Bildschirmfoto 2024-04-25 um 12.35.23.png 420 × 192; 17 KB
 Bildschirmfoto 2024-04-28 um 13.47.20.png 1.886 × 250; 54 KB
 Bonus Malus Systeme.jpg 654 × 311; 49 KB
 Branchenlebenszyklus.jpg 830 × 531; 88 KB
 Brutto-CFROI.png 646 × 166; 39 KB
 Bsp. Projektkalkulation.png 524 × 289; 22 KB
 BusinessCase.jpg 1.146 × 191; 31 KB
 Business Analytics Grafik.png 1.012 × 543; 101 KB
 Business Judgement Rule.png 2.012 × 779; 143 KB
 Business Value Reporting.png 560 × 311; 74 KB
 Böhm SystemThinking Agile.jpg 540 × 499; 39 KB
 CDQ-Modell Baumöl&Meschke2009.jpg 493 × 349; 54 KB
 CFFH Nutzwertanalyse Lösung.PNG 1.038 × 423; 98 KB
 CFROI.png 792 × 164; 47 KB
 CMS nach ISO-Standard.png 1.542 × 1.784; 49 KB
 Cashflow-Marge.png 578 × 166; 32 KB
 Cashflow Investitons-Verhältnis.png 780 × 164; 44 KB
 Center-Konzepte Merchant.jpg 2.064 × 1.291; 154 KB
 CentetrTypen.jpg 797 × 444; 54 KB
 Checkliste Kompetenzenprofil Digital Controller.jpg 288 × 709; 71 KB
 Controlling-Prozess Datenmanagement.jpeg 836 × 456; 104 KB
 Controlling-Prozess Datenmanagement Gleich&Tschandl2018.jpg 836 × 456; 104 KB
 Cost per X.png 451 × 257; 77 KB
 Credit Suisse Studie.png 1.083 × 596; 70 KB
 DGL.jpg 469 × 602; 54 KB
 DIO Formel.JPG 1.232 × 213; 34 KB
 DPO Formel.JPG 1.282 × 310; 41 KB
 DSO Formel.JPG 1.247 × 247; 37 KB
 Darstellung.png 913 × 397; 26 KB
 Darstellung der Zusammenhänge.png 1.002 × 704; 286 KB
 Darstellungsvariante 3.png 725 × 472; 20 KB
 Datelqualitaetsperspektiven Klier&Heinrich2016.jpg 480 × 230; 31 KB
 Datenaufbereitung im Text Mining.png 636 × 184; 30 KB


.png)


.png)


.png)
Zeige (vorherige 100 | nächste 100) (20 | 50 | 100 | 250 | 500)