Nicht kategorisierte Dateien
Aus Controlling-Wiki
Unten werden bis zu 100 Ergebnisse im Bereich 251 bis 350 angezeigt.
Zeige (vorherige 100 | nächste 100) (20 | 50 | 100 | 250 | 500)
 Fallstudie Zumtobel.jpg 1.860 × 1.006; 125 KB
 Flag Kultur gross.jpg 209 × 217; 10 KB
 Flag Strategie gross.jpg 209 × 209; 10 KB
 Flag Struktur gross.jpg 209 × 209; 8 KB
 Flag für Kultur.png 50 × 50; 3 KB
 Flag für Strategie.png 50 × 50; 4 KB
 Flag für Struktur.png 50 × 50; 3 KB
 Formel, Abbildung 3.PNG 877 × 127; 7 KB
 Formel Personalbedarf.PNG 613 × 73; 4 KB
 Formen Dezentralisierung.jpg 751 × 406; 29 KB
 Formen der Arbeitszufriedenheit bei der Filiale A.PNG 690 × 393; 18 KB
 Frage 1.png 366 × 25; 2 KB
 Frage 2.png 612 × 24; 2 KB
 Frage 3.png 639 × 428; 22 KB
 Fraud Triangle.png 1.728 × 945; 19 KB
 Fuchs ProblemMatrix.jpg 759 × 560; 71 KB
 Funktionale Gliederung.JPG 1.033 × 234; 30 KB
 Funktionale Organisation.jpg 3.841 × 932; 143 KB
 Funktionsweise einer Blockchain.jpg 910 × 331; 55 KB
 GAP Abbildung 2.png 1.242 × 710; 165 KB
 GAP Analyse 1.png 1.061 × 279; 53 KB
 Ganzeinheitliches Projektcontrolling.JPG 803 × 510; 52 KB
 Geberit.jpg 1.990 × 623; 160 KB
 Geprueft-negativ.png 140 × 85; 72 KB
 Geprueft-positiv.png 140 × 85; 70 KB
 Gewichtete Zielvereinbarung und Vergütung.jpg 797 × 327; 48 KB
 Grafik.png 518 × 445; 97 KB
 Grafik 1.jpg 1.203 × 565; 89 KB
 Grafik 2 Kopie.jpg 1.050 × 742; 218 KB
 Grafik 3.jpg 941 × 449; 71 KB
 Grafik 4.jpg 476 × 418; 27 KB
 Grafik 6.jpg 1.776 × 1.228; 192 KB
 Grafik 7.jpg 1.100 × 794; 158 KB
 Grafik CAC Wiki 1 Entscheidungspaket Abb. 1.jpg 605 × 147; 36 KB
 Grafik CAC Wiki 2 Entscheidungspakete.jpg 605 × 405; 70 KB
 Grafik Double Irish With a Dutch Sandwich.png 653 × 648; 185 KB
 Grafiken - Durchschnittskosten senken.png 455 × 313; 9 KB
 Grafische Darstellung der Earned Value Analyse.png 907 × 568; 100 KB
 Grenzkosten.png 343 × 517; 153 KB
 Grundfall transaktionsbezogene Nettomargenmethode.png 908 × 309; 95 KB
 HSLU 2022 logo.svg.png 1.280 × 195; 14 KB
 Hauptergebnisse zur Mitarbeiterzufriedenheit .png 626 × 290; 60 KB
 Hebelwirkung.PNG 1.010 × 586; 70 KB
 Henkel.png 799 × 269; 73 KB
 Herausforderungen für das digitale Controlling.jpg 558 × 230; 22 KB
 Hinweistabelle Toyworld.png 1.250 × 166; 20 KB
 Hockey-stick Effekt.png 395 × 186; 8 KB
 Horváth und Partners-Definition von Big Data.png 705 × 577; 187 KB
 Häufige Verteilungsformen in Monte-Carlo-Simulationen.png 413 × 294; 100 KB
 IPOO.JPG 584 × 295; 49 KB
 Images.jpg 275 × 183; 9 KB
 Implementierungspfad zum Re-Design von Planungssystemen.png 605 × 266; 53 KB
 In Anlehnung an (Nadig & Zupan, 2007, S. 314).png 1.294 × 679; 45 KB
 Info.jpg 123 × 121; 3 KB
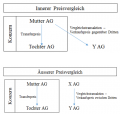 Innerer und ausserer Preisvergleich.png 505 × 481; 61 KB
 Integrationsstufen.jpg 797 × 179; 21 KB
 Integrierte Wertschöpfungs-& Controllinginformationen .png 906 × 420; 79 KB
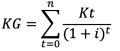 KG.png 396 × 168; 14 KB
 KTA-Darstellungsvariante 1.png 529 × 260; 13 KB
 KTA-Schritt 1.png 795 × 470; 9 KB
 KTA-Schritt 4.PNG 691 × 419; 23 KB
 Kapitalbindungsdauer.jpg 1.878 × 1.090; 175 KB
 Kapitalwert, Barwert und Gegenwartswert von Kosten und Nutzen.png 1.699 × 289; 35 KB
 Kennzahlen.png 937 × 1.368; 145 KB
 Kennzahlensysteme.jpeg 768 × 666; 76 KB
 Klassifizierung ABC-Analyse.png 1.008 × 575; 62 KB
 Klassifizierung Ansätze.png 1.260 × 520; 44 KB
 Klassifizierung Budgetierungsansätze.png 3.780 × 1.702; 151 KB
 Klassifizierung von Investitionen.png 539 × 278; 10 KB
 Klassisch vs bonusbank.PNG 1.454 × 751; 95 KB
 Klassischer und Rolling Forecast im Vergleich.png 605 × 224; 45 KB
 Konzepte der Investitionsrechnung.PNG 592 × 380; 22 KB
 Kosten- und Preiserfahrungskurve.jpg 684 × 444; 34 KB
 Kosten der Personalbeschaffung (Seidel, 2010, S. 42).png 630 × 300; 179 KB
 Kostentrendanalyse Hotea AG.png 1.209 × 233; 25 KB
 Kostentrendanalyse Hotea AG Grafik.png 742 × 384; 23 KB
 Kundenanalyse.png 1.052 × 414; 81 KB
 Kundendeckungsbeitragsrechnung.jpg 1.309 × 1.079; 174 KB
 LCA.jpg 1.200 × 1.015; 151 KB
 LCC.JPG 596 × 277; 45 KB
 Leistungsmanagement in multinationalen Unternehmen.jpg 488 × 628; 45 KB
 Leistungsmessung als Kommunikationsinstrument.jpg 743 × 396; 46 KB
 Leitmotive des Advanced Budgetings.png 750 × 417; 293 KB
 Life Cycle Costing.JPEG 596 × 277; 45 KB
 Life Cycle Costing.jpg 596 × 277; 45 KB
 Lösung.JPG 601 × 429; 56 KB
 Lösung 1.png 1.361 × 976; 124 KB
 Lösung Aufg.2.png 1.010 × 622; 68 KB
 Lösung Aufgabe 2.png 1.536 × 310; 46 KB
 Lösung Aufgabe 3.png 1.506 × 302; 39 KB
 Lösung Beurteilung Branchenstrukturanalyse.jpg 925 × 511; 53 KB


.jpg)


.png)


.jpg)


.png)


.jpg)
Zeige (vorherige 100 | nächste 100) (20 | 50 | 100 | 250 | 500)