Nicht kategorisierte Dateien
Aus Controlling-Wiki
Unten werden bis zu 250 Ergebnisse im Bereich 51 bis 300 angezeigt.
Zeige (vorherige 250 | nächste 250) (20 | 50 | 100 | 250 | 500)
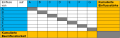
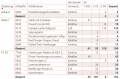 Abbildung 1 Lagerentnahmen in KW 39.png 1.030 × 678; 243 KB
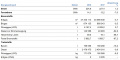
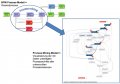
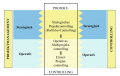
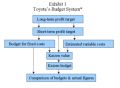 Abbildung 1 Toyotas Budget Modell.png 715 × 522; 129 KB
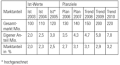
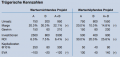 Abbildung 1 Trügerische Kennzahlen.png 571 × 269; 36 KB
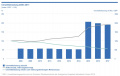
 Abbildung 2.png 585 × 206; 7 KB
 Abbildung 2 Discounted Cash Flow Methoden (Gladen, 2008, S. 116).jpg 773 × 466; 86 KB
 Abbildung 2 Kalkulation des deklarierten Bonus.png 623 × 89; 4 KB
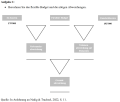
 Abbildung 2 Lösungsraster Fallstudie.png 723 × 445; 3 KB
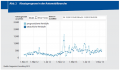
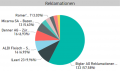 Abbildung 2 Reklamationen nach Kundengruppen.png 767 × 451; 96 KB
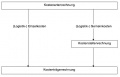
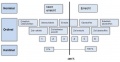
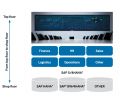 Abbildung 2 Struktur.jpg 908 × 742; 87 KB
 Abbildung 3 EVA – Bonussystem.png 775 × 449; 17 KB
 Abbildung 3 Lösung Fallstudie.png 1.071 × 532; 31 KB
 Abbildung 7 Mögliche Auszahlungsformen einer Bonusbank.png 969 × 614; 72 KB
 Abbildung Schnittstellen.jpg 944 × 456; 70 KB
 Abbildung VaR.jpg 1.177 × 541; 31 KB
 Abbildung investiertes Betriebskapital.png 641 × 338; 77 KB
 Abgrenzung.jpg 1.038 × 676; 112 KB
 Abgrenzung F&E-Controlling zu Innovationscontrolling.png 748 × 143; 6 KB
 Ablauf ABC-Analyse2.png 2.073 × 320; 119 KB
 Ablauf Earned Value Analyse).png 577 × 336; 10 KB
 Ablauf Earned Value Analyse.png 577 × 336; 10 KB
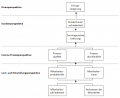
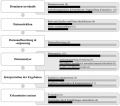
 Ablauf Verrechnungspreisdokumentation.png 719 × 172; 14 KB
 Ablauf einer Transaktion.jpg 559 × 356; 38 KB
 Abrechnungslogistik.jpeg 583 × 376; 25 KB
 Absatzprognose in der Automobilbranche.png 770 × 447; 91 KB
 Abzinsung der Nettozahlungen.PNG 411 × 222; 30 KB
 Aggregierte Kosten-Nutzen-Analyse (Seidel, 2010, S. 59).png 707 × 350; 135 KB
 Agile Planung.png 481 × 459; 79 KB
 Aktivitätensplit im Reporting-Prozess (Grönke et al., 2014, S. 78).png 1.045 × 504; 105 KB
 Amortisationen EVA.jpg 807 × 466; 27 KB
 AndersonCarmichael Kanbanboard.jpg 727 × 315; 78 KB
 Anreizsysteme Trachsel.jpg 1.056 × 653; 124 KB
 Ansätze der Budgeterstellung (Behrens & Feuerlohn, 2018, S. 176).png 1.140 × 492; 105 KB
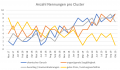 Anzahl Nennungen pro Cluster.png 1.128 × 654; 83 KB
 Architektur eines Data Warehouses (Müller & Lenz, 2013, S. 19).png 1.309 × 775; 208 KB
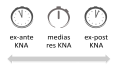 Arten von Kosten-Nutzen-Analysen (KNA).png 1.329 × 758; 87 KB
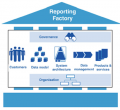 AufbauReportingFactory.png 410 × 375; 86 KB
 Aufgabe.JPG 737 × 458; 58 KB
 Aufgabe 1.png 1.361 × 1.154; 140 KB
 Aufgabe 2.jpg 1.987 × 980; 384 KB
 Aufgabe 2 Einflussmatrix.png 759 × 243; 15 KB
 Aufgabe 3.jpg 2.014 × 1.005; 250 KB
 Aufgabe 3 Projektabhängigkeitsportfolio.png 759 × 448; 13 KB
 Aufgabe 5.jpg 1.139 × 722; 88 KB
 Aufgabe 6.jpg 851 × 246; 42 KB
 Aufgabe Datenqualität Bayer CropScience AG.jpg 784 × 524; 61 KB
 Aufgabe TecXPhone AG.pdf ; 144 KB
 Aufgaben Beschaffungscontrolling.jpg 1.197 × 559; 62 KB
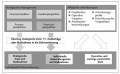
 Aufgaben IT.PNG 1.011 × 380; 157 KB
 Aufgaben des Absatzcontrollings.png 782 × 429; 151 KB
 Aufgabentypen des Controllings (Eder, 2016, S. 104).png 480 × 185; 20 KB
 Aufschlüsselung der Gesamtabweichung.png 1.867 × 617; 61 KB
 Aufspaltung des Erlöses in edogene und exogene Ursachen.jpg 879 × 601; 53 KB
 Aufstellung des familienfreundlichen Pakets (Seidel, 2010, S. 49).png 586 × 344; 168 KB
 Augustus AG Auswertung.png 943 × 479; 90 KB
 Augustus AG Rangfolge.PNG 1.210 × 772; 282 KB
 Ausgewählte Anpassungen bei der NOPAT-Ermittlung.png 686 × 425; 90 KB
 Auswahl Messgrössen.jpg 3.077 × 1.919; 387 KB
 BCG Matrix Lippold.PNG 605 × 364; 67 KB
- BIVAL Fallstudie.pdf ; 56 KB
 BI Anwendungsklassen.png 722 × 349; 31 KB
 BSC-basiertes Anreizsystem Becker, Schwertner & Seubert 2004.jpg 846 × 516; 45 KB
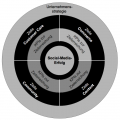
 BSC - Social Media Marketing Perspektive.png 1.979 × 714; 74 KB
 BS Simons.png 706 × 535; 28 KB
 Backlog und Sprintbacklog.png 700 × 342; 17 KB
 Basisschema Centererfolgsrechnung.jpg 696 × 250; 21 KB
 Baubewilligung.png 860 × 629; 294 KB
 Bedeutung Kaizen.png 480 × 336; 59 KB
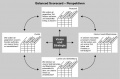
 Beispiel Balanced Scorecard.jpg 1.292 × 768; 179 KB
 Beispiel Komponentenmethode.png 740 × 283; 96 KB
 Beispiel Transformation von fixen Kosten in variable Kosten.jpg 1.753 × 1.040; 217 KB
 Beispiel einer Potenzialanalyse.JPG 1.075 × 788; 120 KB
 Beispiel einer Ursache-Wirkungskette.PNG 733 × 597; 16 KB
 Beispiel eines Absatzplanes.png 324 × 176; 9 KB
 Beispiel für ein Zielvereinbarungsformular.png 787 × 412; 21 KB
 Beispiel für unterschiedliche Bewertungsverfahren.jpeg 758 × 394; 100 KB
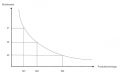 Beispielhafte Darstellung Erfahrungskurve.jpg 1.160 × 718; 36 KB
 Beitragsanalyse.png 798 × 432; 142 KB
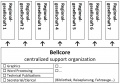 Bellcore Organisation.jpg 1.627 × 1.142; 185 KB
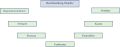 Benchmarking-Objekte.jpg 2.078 × 806; 100 KB
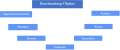 Benchmarking-Objekte.png 2.080 × 861; 92 KB
 Benchmarkingprozess.png 197 × 714; 41 KB
 Benfordsches Gesetz.png 605 × 400; 134 KB
 Berechnung flexibles Budget.jpg 605 × 330; 31 KB
 Berechnung gleitender Durchschnitt.png 323 × 217; 56 KB
 Beschaffungscontrolling Component Chart.png 478 × 463; 20 KB
 Beschreibung.png 906 × 114; 30 KB
 Best-Case-Szenario-Bleistifte.jpg 1.648 × 844; 117 KB
 Bestandteile Verrechnungspreisdokumentation.png 755 × 221; 16 KB
 Bestandteile von Business Analytics.jpg 1.115 × 601; 85 KB
 Bestimmung des Deckungsbeitrags.jpg 386 × 184; 14 KB
 Beurteilung Branchenstrukturanalyse.png 1.145 × 233; 77 KB
 Bewertungsansätze.png 1.439 × 965; 103 KB
 Bild1.png 425 × 260; 67 KB
 Bild2.png 388 × 362; 18 KB
 Bild 2.png 1.918 × 1.261; 170 KB
 Bild Branchen.png 2.624 × 1.625; 178 KB
 Bild Social Media.png 2.659 × 1.244; 157 KB
 Bild Trumpf.jpg 920 × 615; 76 KB
 Bild Veränderung Conversions.jpg 610 × 224; 69 KB
 Bild Vorgehen.png 2.803 × 871; 95 KB
 Bildschirmfoto 2024-04-25 um 12.28.19.png 420 × 178; 17 KB
 Bildschirmfoto 2024-04-25 um 12.34.27.png 406 × 196; 17 KB
 Bildschirmfoto 2024-04-25 um 12.35.23.png 420 × 192; 17 KB
 Bildschirmfoto 2024-04-28 um 13.47.20.png 1.886 × 250; 54 KB
 Bonus Malus Systeme.jpg 654 × 311; 49 KB
 Branchenlebenszyklus.jpg 830 × 531; 88 KB
 Brutto-CFROI.png 646 × 166; 39 KB
 Bsp. Projektkalkulation.png 524 × 289; 22 KB
 BusinessCase.jpg 1.146 × 191; 31 KB
 Business Analytics Grafik.png 1.012 × 543; 101 KB
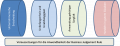 Business Judgement Rule.png 2.012 × 779; 143 KB
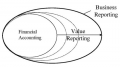 Business Value Reporting.png 560 × 311; 74 KB
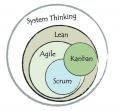 Böhm SystemThinking Agile.jpg 540 × 499; 39 KB
 CDQ-Modell Baumöl&Meschke2009.jpg 493 × 349; 54 KB
 CFFH Nutzwertanalyse Lösung.PNG 1.038 × 423; 98 KB
 CFROI.png 792 × 164; 47 KB
 CMS nach ISO-Standard.png 1.542 × 1.784; 49 KB
 Cashflow-Marge.png 578 × 166; 32 KB
 Cashflow Investitons-Verhältnis.png 780 × 164; 44 KB
 Center-Konzepte Merchant.jpg 2.064 × 1.291; 154 KB
 CentetrTypen.jpg 797 × 444; 54 KB
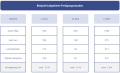
 Checkliste Kompetenzenprofil Digital Controller.jpg 288 × 709; 71 KB
 Controlling-Prozess Datenmanagement.jpeg 836 × 456; 104 KB
 Controlling-Prozess Datenmanagement Gleich&Tschandl2018.jpg 836 × 456; 104 KB
 Cost per X.png 451 × 257; 77 KB
 Credit Suisse Studie.png 1.083 × 596; 70 KB
 DGL.jpg 469 × 602; 54 KB
 DIO Formel.JPG 1.232 × 213; 34 KB
 DPO Formel.JPG 1.282 × 310; 41 KB
 DSO Formel.JPG 1.247 × 247; 37 KB
 Darstellung.png 913 × 397; 26 KB
 Darstellung der Zusammenhänge.png 1.002 × 704; 286 KB
 Darstellungsvariante 3.png 725 × 472; 20 KB
 Datelqualitaetsperspektiven Klier&Heinrich2016.jpg 480 × 230; 31 KB
 Datenaufbereitung im Text Mining.png 636 × 184; 30 KB
 Datenmanagement als Schnittstelle Langmann2019.jpg 789 × 232; 31 KB
 Datenquellen und-sammlung.png 864 × 504; 107 KB
 Db.png 524 × 114; 17 KB
 Deckungsbeitragsrechnung mit relativen Einzelkosten.png 732 × 492; 194 KB
 Definition des Immobiliencontrollings.png 621 × 525; 55 KB
 Definitionen des Working Capitals.jpg 788 × 612; 115 KB
 Der Controller als Business Partner über die Zeit.png 853 × 549; 103 KB
 Die 4 Social C zur Erfolgsmessung von Social Media.png 607 × 605; 122 KB
 Die Balanced Scorecard als Quelle für individuelle Ziele.jpg 704 × 437; 53 KB
 Die Funktionen des Umweltcontrollings.png 480 × 321; 22 KB
 Die vier Perspektiven der Balanced Scorecard nach Kaplan, Norton.jpg 727 × 481; 48 KB
 Digtal Controlling.jpg 836 × 494; 150 KB
 Dimensionen der digitalen Kompetenzen.jpg 354 × 332; 21 KB
 Divisionale Organisation.JPG 1.338 × 586; 63 KB
 Donts.jpg 180 × 179; 6 KB
 Dos.jpg 179 × 179; 6 KB
 Drei Typen.png 727 × 387; 111 KB
 DuPont Kennzahlensystem.jpg 1.413 × 960; 87 KB
 Dynamische und statische Effekte.jpg 1.386 × 610; 68 KB
 EVA-Konzept.jpg 1.437 × 768; 65 KB
 EVA Conversions.png 1.382 × 685; 62 KB
 Einfluss von der Blockchain auf die Controlling Tätigkeiten.jpg 446 × 336; 15 KB
 Einigungsbereich bei Verhandlungen.png 649 × 368; 105 KB
 Einordnung Produktionscontrolling in die Lieferkette.PNG 1.006 × 332; 31 KB
 Einsatzbereiche für BI (Christ et al., 2015, S. 17).png 606 × 354; 30 KB
 Einstufige deckungsbeitragsrechnung.png 574 × 114; 46 KB
 Einzeljahresziel mit mehrjähriger Bonusbank S577.PNG 1.007 × 606; 78 KB
 ElementeTOM.png 552 × 322; 44 KB
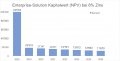 Enterprise-Solution Barwert.png 2.762 × 1.394; 167 KB
 Enterprise-Solution Zahlungsstroeme.png 2.762 × 1.394; 136 KB
 Entity Equity.png 830 × 475; 323 KB
 Entscheidungskriterium Vorteilhafte und Unvorteilhafte Investition.png 1.583 × 297; 20 KB
 EntwicklungReportingFactory.png 1.378 × 700; 489 KB
 Entwicklung des Verständnisses und der Aufgaben des Controllings.JPG 2.019 × 1.215; 169 KB
 Entwicklung vom Fragezeichen zum Star.JPG 876 × 449; 39 KB
 Erfahrungskurve.jpg 807 × 480; 35 KB
 Erfahrungskurven mit unterschiedlichen Entwicklungen.jpg 656 × 418; 34 KB
 Erfolg der Unternehmen mit Anreizsystemen.png 759 × 454; 25 KB
 Erfolgswirkung von Anreizsystemen.png 609 × 419; 54 KB
 Ergebnis einer Simulation in der Unternehmensplanung.png 931 × 479; 110 KB
 Erstellung des Kaizen Budgets.png 1.342 × 815; 25 KB
 Explorativ.jpg 470 × 649; 49 KB
 Fachkompetenzen und Aufgaben des Data Scientist.PNG 550 × 486; 64 KB
 Fallegger.jpg 640 × 846; 34 KB
 Fallstudie.png 679 × 322; 22 KB
 Fallstudie ZBB Grafik 1.jpg 750 × 280; 56 KB
 Fallstudie ZBB Grafik 2.jpg 750 × 239; 53 KB
 Fallstudie ZBB Grafik 3.jpg 750 × 241; 51 KB
 Fallstudie Zumtobel.jpg 1.860 × 1.006; 125 KB
 Flag Kultur gross.jpg 209 × 217; 10 KB
 Flag Strategie gross.jpg 209 × 209; 10 KB
 Flag Struktur gross.jpg 209 × 209; 8 KB
 Flag für Kultur.png 50 × 50; 3 KB
 Flag für Strategie.png 50 × 50; 4 KB
 Flag für Struktur.png 50 × 50; 3 KB
 Formel, Abbildung 3.PNG 877 × 127; 7 KB
 Formel Personalbedarf.PNG 613 × 73; 4 KB
 Formen Dezentralisierung.jpg 751 × 406; 29 KB
 Formen der Arbeitszufriedenheit bei der Filiale A.PNG 690 × 393; 18 KB
 Frage 1.png 366 × 25; 2 KB
 Frage 2.png 612 × 24; 2 KB
 Frage 3.png 639 × 428; 22 KB
 Fraud Triangle.png 1.728 × 945; 19 KB
 Fuchs ProblemMatrix.jpg 759 × 560; 71 KB
 Funktionale Gliederung.JPG 1.033 × 234; 30 KB
 Funktionale Organisation.jpg 3.841 × 932; 143 KB
 Funktionsweise einer Blockchain.jpg 910 × 331; 55 KB
 GAP Abbildung 2.png 1.242 × 710; 165 KB
 GAP Analyse 1.png 1.061 × 279; 53 KB
 Ganzeinheitliches Projektcontrolling.JPG 803 × 510; 52 KB
 Geberit.jpg 1.990 × 623; 160 KB
 Geprueft-negativ.png 140 × 85; 72 KB
 Geprueft-positiv.png 140 × 85; 70 KB
 Gewichtete Zielvereinbarung und Vergütung.jpg 797 × 327; 48 KB
 Grafik.png 518 × 445; 97 KB
 Grafik 1.jpg 1.203 × 565; 89 KB
 Grafik 2 Kopie.jpg 1.050 × 742; 218 KB
 Grafik 3.jpg 941 × 449; 71 KB
 Grafik 4.jpg 476 × 418; 27 KB
 Grafik 6.jpg 1.776 × 1.228; 192 KB
 Grafik 7.jpg 1.100 × 794; 158 KB
 Grafik CAC Wiki 1 Entscheidungspaket Abb. 1.jpg 605 × 147; 36 KB
 Grafik CAC Wiki 2 Entscheidungspakete.jpg 605 × 405; 70 KB
 Grafik Double Irish With a Dutch Sandwich.png 653 × 648; 185 KB
 Grafiken - Durchschnittskosten senken.png 455 × 313; 9 KB
 Grafische Darstellung der Earned Value Analyse.png 907 × 568; 100 KB
 Grenzkosten.png 343 × 517; 153 KB
 Grundfall transaktionsbezogene Nettomargenmethode.png 908 × 309; 95 KB
 HSLU 2022 logo.svg.png 1.280 × 195; 14 KB
 Hauptergebnisse zur Mitarbeiterzufriedenheit .png 626 × 290; 60 KB
 Hebelwirkung.PNG 1.010 × 586; 70 KB
 Henkel.png 799 × 269; 73 KB
 Herausforderungen für das digitale Controlling.jpg 558 × 230; 22 KB
 Hinweistabelle Toyworld.png 1.250 × 166; 20 KB
 Hockey-stick Effekt.png 395 × 186; 8 KB


.jpg)


.jpg)


.png)


.png)

.png)


.png)

.png)
.png)


.png)


.png)


.png)


.png)


.jpg)


.jpg)
.jpg)
.png)
.jpg)
Zeige (vorherige 250 | nächste 250) (20 | 50 | 100 | 250 | 500)