Nicht kategorisierte Dateien
Aus Controlling-Wiki
Unten werden bis zu 124 Ergebnisse im Bereich 501 bis 624 angezeigt.
Zeige (vorherige 500 | nächste 500) (20 | 50 | 100 | 250 | 500)
 Steuerliche Verrechnungspreismethoden.jpg 1.780 × 630; 110 KB
 Stoppwortbereinigung.png 393 × 202; 29 KB
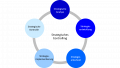
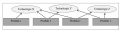
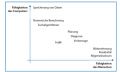
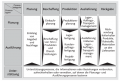
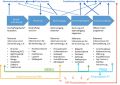
 StrategischePlanung.png 1.641 × 641; 26 KB
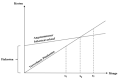
 Strategische Lücke.JPG 864 × 598; 37 KB
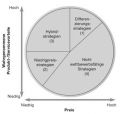 Strategische Uhr.jpg 394 × 373; 27 KB
 Strategisches Controlling.png 1.884 × 1.065; 80 KB
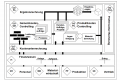
 Struktur.PNG 1.615 × 1.512; 452 KB
 Struktur LCC.PNG 532 × 492; 70 KB
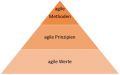 Struktur agile Methoden eigene Darstellung.JPG 1.103 × 685; 40 KB
 Stuck in the Middle.jpg 756 × 418; 36 KB
 Stufenebenen.jpg 784 × 556; 36 KB
 Stufenebenen der Erlösabweichung.jpg 942 × 612; 48 KB
 Stärken-Schwächen-Profil Fallstudie.jpg 1.386 × 620; 90 KB
 Stärken-Schwächen-Profil Fallstudie Lösung.jpg 557 × 254; 31 KB
 Stärken halten.PNG 734 × 403; 45 KB
 Systeme der flexiblen Plankostenrechnung.png 602 × 298; 7 KB
 Szenarienanalyse mittels Monte-Carlo-Simulation.png 746 × 494; 90 KB
 TPA Abbildung 1.jpg 740 × 841; 172 KB
 TPA Abbildung 2.2.JPG 973 × 250; 37 KB
 TPA Abbildung 3.jpg 682 × 473; 37 KB
 TPA Abbildung 4.jpg.jpg 526 × 471; 42 KB
 TPA Abbildung 5.jp.jpg 796 × 311; 29 KB
 TPA Fallstudie.JPG 729 × 662; 45 KB
 TPA Fallstudie Lösung.JPG 773 × 669; 44 KB
 Tabelle 1.png 1.336 × 576; 40 KB
 Tabelle 1 Toyworld.png 1.215 × 661; 69 KB
 Tabelle 2.png 1.329 × 553; 34 KB
 Tabelle Lösung XY Auto AG 1.png 791 × 476; 40 KB
 Tabelle Lösung XY Auto AG 2.png 476 × 357; 20 KB
 Tabelle XY Auto AG.png 573 × 710; 45 KB
 Tabelle zur Beurteilung der Branchenstrukturanalyse.jpg 925 × 504; 49 KB
 Taxmedia AG - Bilanz und ER.png 588 × 562; 105 KB
 Taxmedia AG - Lösung.png 417 × 564; 85 KB
 Taxmedia AG - Weitere Angaben.png 619 × 180; 49 KB
 TecXPhone AG - Funktionen-Komponenten-Matrix.png 1.354 × 361; 37 KB
 TecXPhone AG - Funktionen-Komponenten-Matrix Lösung.png 1.764 × 750; 227 KB
 TecXPhone AG - Grafik Funktionsgewichtung der Kundschaft in %.png 1.957 × 848; 26 KB
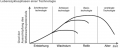 Technologielebenszyklus Arthur D. Little.PNG 849 × 340; 70 KB
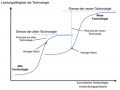 Technologielebenszyklus McKinsey.PNG 480 × 358; 52 KB
 Test.jpg 1.164 × 701; 61 KB
 Test 2.jpg 346 × 346; 65 KB
 Test 2 Controlling.jpeg 346 × 346; 65 KB
 Test Controlling.png 1.400 × 998; 150 KB
 Test Target Costing.png 484 × 299; 76 KB
 Text Mining-Prozess.png 827 × 101; 41 KB
 Text Mining.png 1.124 × 680; 418 KB
 Themensuche.jpg 300 × 300; 41 KB
 Tokenization.png 605 × 148; 34 KB
 Trachsel.jpg 337 × 449; 152 KB
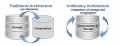 Traditional Architecture vs. In-Memory Architecture.png 605 × 231; 128 KB
 Treiberbaum als Beispiel.jpg 1.125 × 980; 121 KB
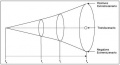 Trichter-Modell.jpg 448 × 242; 22 KB
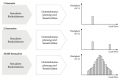
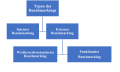 Typen des Benchmarkings.png 1.695 × 1.022; 164 KB
 U3 Exaimpel AG - DCF-Berechnung Aufgabe Tabelle.jpg 568 × 271; 40 KB
 U3 Exaimpel AG - DCF-Berechnung Lösung Berechnung.jpg 1.174 × 391; 78 KB
 U3 Exaimpel AG - DCF-Berechnung Lösung Tabelle.jpg 947 × 465; 103 KB
 U3 Exaimpel AG DCF-Berechnung Lösung Tabelle.jpg 523 × 296; 42 KB
 U6 Exaimpel AG - EVA-Berechnung Aufgabe Tabelle.jpg 681 × 541; 110 KB
 U6 Exaimpel AG - EVA-Berechnung Lösung Berechnung.jpg 1.093 × 509; 106 KB
 U6 Exaimpel AG - EVA-Berechnung Lösung Tabelle.jpg 601 × 453; 82 KB
 Uncertainty-Impact-Analyse.jpg 1.389 × 760; 81 KB
 Uncertainty.jpg 640 × 503; 35 KB
 Unternehmenszyklus S.png 703 × 574; 30 KB
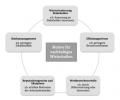 Unternehmerische Motive für Umweltcontrolling.png 437 × 363; 59 KB
 Unterschiede der Basisarten der flexiblen Plankostenrechnung.png 1.361 × 852; 222 KB
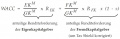
 VaR Konzepte.jpg 1.024 × 362; 40 KB
 Variante 2.PNG 1.090 × 764; 416 KB
 Verbesserungen erzielen.PNG 722 × 326; 13 KB
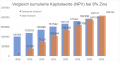 Vergleich kumulierte Kapitalwerte.png 2.762 × 1.394; 227 KB
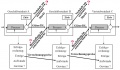
 Verknüpfung erste und zweite Ebene – SCOR-Modell.png 770 × 520; 180 KB
 Verrechnete Plankosten in der starren Plankostenrechnung.png 467 × 308; 17 KB
 Verrechnungspreise Simons.jpg 1.094 × 641; 91 KB
 Verschleierung der Kostenstruktur.jpg 820 × 461; 20 KB
 Verschuldungsfaktor.png 628 × 167; 41 KB
 Verteilung Zielherstellkosten.png 740 × 241; 47 KB
 Vertikale und horizontale Integration.jpg 981 × 412; 61 KB
 Vertragsstruktur OnPremises EnterpriseSolution.png 1.245 × 471; 20 KB
 Vertragsstruktur SaaS Loesung.png 1.245 × 346; 10 KB
 Veränderung der Aufgaben des Controllers.jpg 1.024 × 476; 61 KB
 Visualisierung der Prozesskostenrechnung.jpg 547 × 674; 106 KB
 Vorgehen Komponenten-Funktions-Matrix.png 737 × 461; 112 KB
 Vorgehen zur Anpasung der Vermögensgrösse NOA.jpg 958 × 382; 94 KB
 Vorgehensweise der Monte-Carlo-Simulation nach Wolf.png 316 × 329; 49 KB
 VorteileLiftShift.png 552 × 292; 40 KB
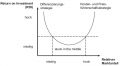
 WPM Preisvergleich.png 545 × 666; 112 KB
 Waldhaus Bau AG - Lösungen.xlsx ; 67 KB
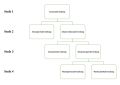
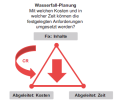
 Wasserfall-Planung.png 288 × 260; 29 KB
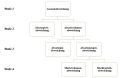
 Wasserfall Planung.png 390 × 342; 21 KB
 Weighted Average Cost of Capital.jpg 1.024 × 331; 41 KB
 Wells fargo.jpeg 606 × 340; 86 KB
 Werteflussdiagramm S. Oliver Group.jpg 1.160 × 823; 151 KB
 Werteflüsse am Beispiel SAP R-3.png 720 × 482; 122 KB
 Wertkettenmodell.jpg 729 × 407; 35 KB
 Wertschöpfungsstufen IoT.png 666 × 417; 69 KB
 What-is-saas.png 2.382 × 816; 204 KB
 Worst-Case-Szenario-Bleistifte.jpg 1.646 × 840; 144 KB
 YoCo AG Bilanz.png 576 × 955; 99 KB
 YoCo AG Erfolgsrechnung.jpg 791 × 713; 91 KB
 YoCo AG Geldflussrechnung.jpg 391 × 713; 68 KB
 ZVEI-Kennzahlensystem.jpg 957 × 533; 66 KB
 Z Definition des Capital Employed aktivisch TK.jpg 238 × 315; 33 KB
 Zahlenbeispiel.jpg 682 × 460; 57 KB
 Zentralisierung.jpg 1.117 × 267; 40 KB
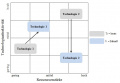
 Zielkostendiagramm.png 726 × 516; 112 KB
 Zielsetzungen der Dezentralisierung.jpg 2.298 × 1.440; 232 KB
 Zielvereinbarungen führen zu echten Verhaltensänderungen.JPG 932 × 483; 60 KB
 Zitat Fiedler.JPG 449 × 121; 17 KB
 Zukunmo AG - Lösung.pdf ; 36 KB
 Zusammenspiel Levers of Control.jpeg 1.280 × 919; 101 KB
- Zusatzmaterial.Aufgabe.xlsx ; 36 KB
 Übersicht Budgetierung bei Plankostenrechnung.png 841 × 434; 48 KB
 Übersicht Instrumente Personalcontrolling.PNG 858 × 572; 47 KB


.jpg)
.jpg)


.PNG)


.png)
Zeige (vorherige 500 | nächste 500) (20 | 50 | 100 | 250 | 500)